Experience Center
About the 3rd-Party App Governance Dashboard
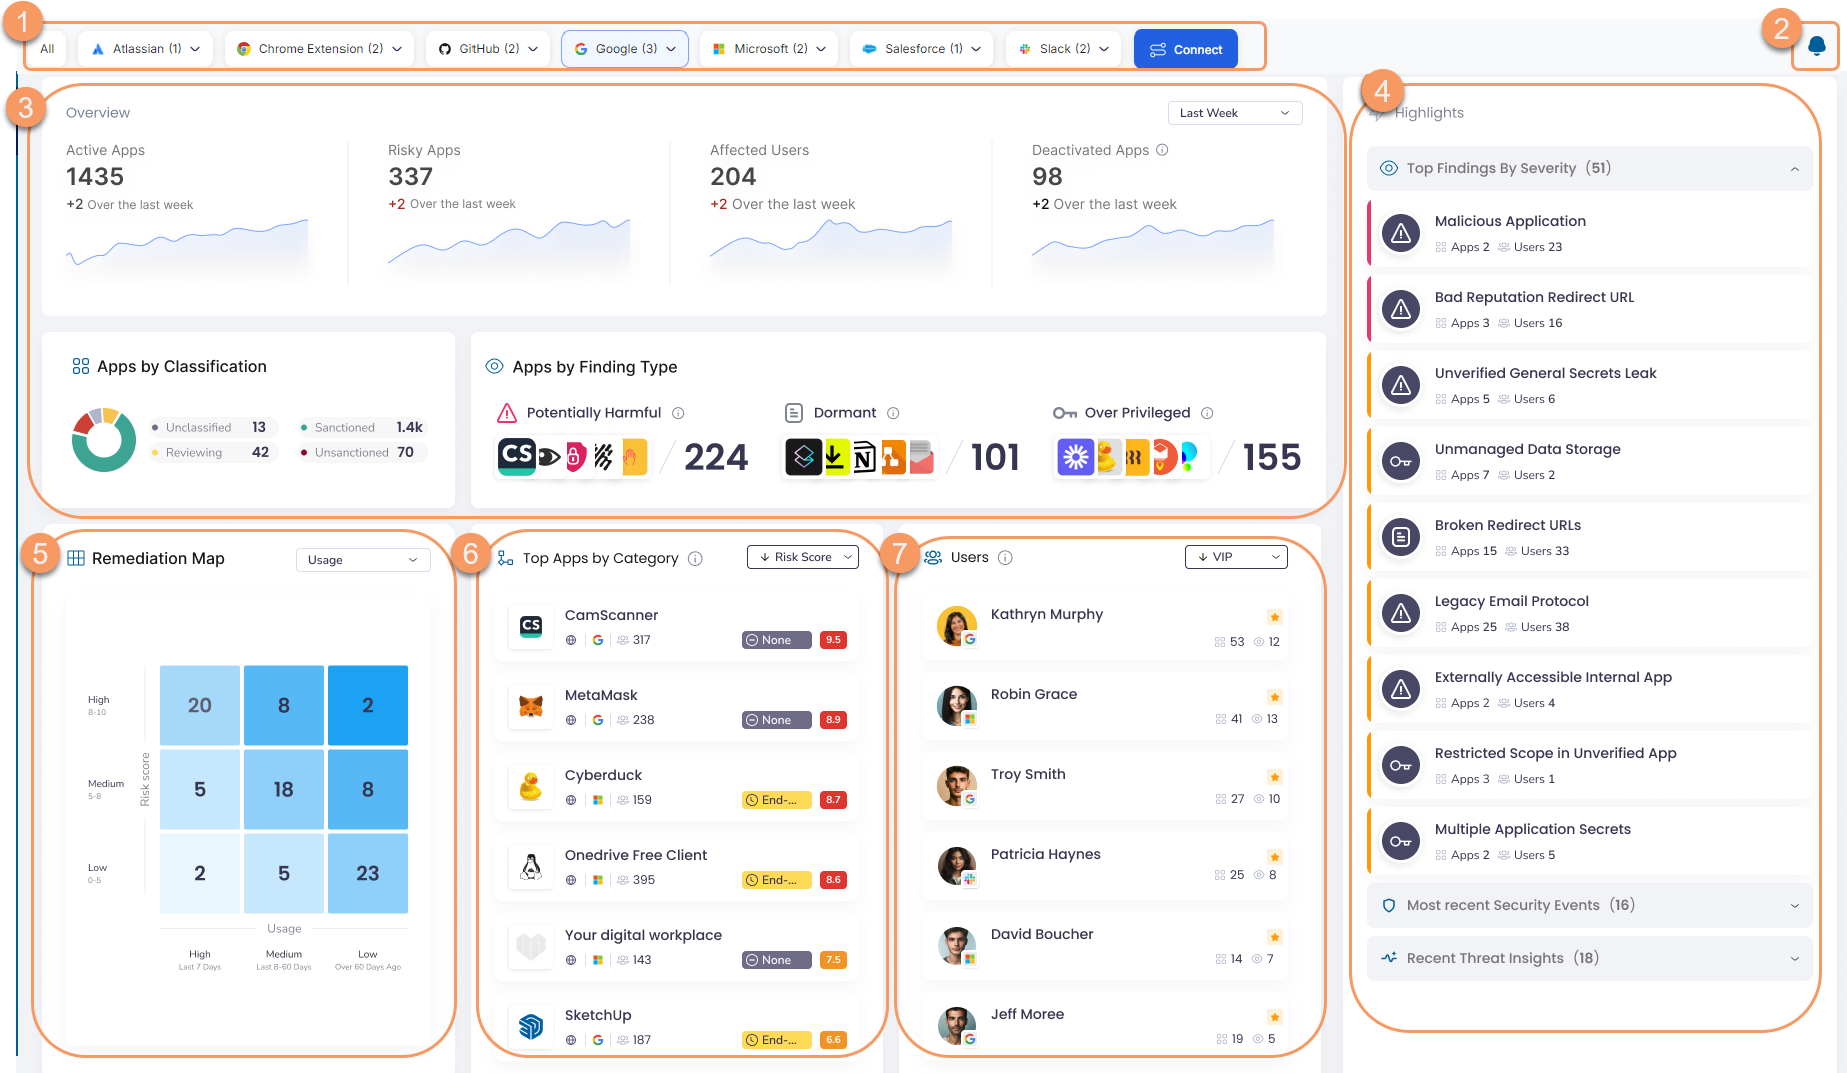
When you access the Zscaler 3rd-Party App Governance Admin Portal, the dashboard is displayed automatically. The dashboard contains 7 predefined widgets with information about potentially risky apps and their usage among your users.
The first time you access the 3rd-Party App Governance Admin Portal, the dashboard is empty until you connect your platform by clicking Add New Integration, or search for and manually add apps.
The 3rd-Party App Governance dashboard provides the following benefits and enables you to:
- View a high-level overview of all active and deactivated apps, and risky, potentially harmful, dormant, and overprivileged third-party apps, add-ons, and browser extensions across your business and the affected users.
- Leverage remediation maps organized by risk or app usage to strengthen your security posture where it will have the greatest impact.
About the Dashboard Page
On the Dashboard page, you can view the following predefined widgets:
- 1. Integrations
The Integrations banner displays buttons for each currently configured integration, as well as an All button which is selected by default, so the dashboard displays the status for all integrations:
To view the status for individual integrations (e.g., Google Workspace), click the button for that integration.
Multiple integration views can be selected at a time. To revert to seeing all the integrations, click All.
- To add another integration, click Connect. To learn more, see Connecting Your Platforms to 3rd-Party App Governance.
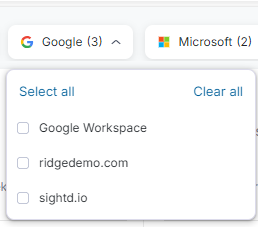
To select one or more tenants for a platform, click the drop-down arrow on the button for that platform, and select the desired tenants from the drop-down menu. When you select a platform, all the tenants for that platform are selected by default.
When a single tenant or multiple tenants are onboarded, a pending icon appears next to the tenants and the relevant platform to indicate that the tenants are still being processed. An error icon appears next to the tenants and the relevant platform to indicate an error.
- 2. Notifications
The Notifications icon opens a window that displays all recent notifications. Notifications are configured with policies. To learn more, see 3rd-Party App Governance Policies.
Close - 3. Overview
The Overview widget displays an overview of your current app profile:
- Active Apps: Shows the number of active apps. Click the number to see a list of those apps on the Inventory page. The graph displays the number of active apps over a period of time. You can use the filter to view the number of active apps over a specific time period.
- Risky Apps: Shows the number of apps that are classified as risky. Click the number to see a list of those apps on the Inventory page, where you can take various actions on them. The graph displays the number of risky apps over a period of time. You can use the filter to view the number of risky apps over a specific time period.
- Affected Users: Shows the number of users who are affected by the risky apps. Click the number to see those users on the Users page, where you can take various actions on them. The graph displays the number of affected users over a period of time. You can use the filter to view the number of affected users over a specific time period.
- Deactivated Apps: Shows the number of deactivated apps. Click the number to see a list of those apps on the Inventory page. The graph displays the number of deactivated apps over a period of time. You can use the filter to view the number of deactivated apps over a specific time period.
- Apps by Classification: Shows a breakdown of apps by whether they are unclassified, reviewed, sanctioned, or unsanctioned. Click a number to display those apps on the Inventory page.
- Apps by Finding Type: Shows a breakdown of apps by whether they are potentially harmful, dormant, or overprivileged. Click a number to display those apps on the Inventory page.
- 4. Highlights
The Highlights widget displays a list of current findings, ordered by severity. Findings are security posture issues identified in an app that indicate their risk and severity. Click any of the findings to see more details, such as the number of apps, users affected, and suggested next steps.
Close - 5. Remediation Map
The Remediation Map widget shows your app risk in a grid. Use the drop-down menu to display apps by either Severity or Usage. Click any quadrant in the grid to display those apps in the Inventory page, where you can take action on them.
Close - 6. Top Apps
The Top Apps by Category widget displays a list of top apps. Use the drop-down menu to display the apps by Risk Score, Popularity, High Privilege, or Low Usage. Click any app in the list to display information about that app. To learn more, see About the App Panel.
Close - 7. Users
The Users widget displays a list of users. Use the drop-down menu to display the users by VIP, Privileged, Apps, or Findings. Click any user in the list to display information about that user.
Close

