Experience Center
Managing Top Private Applications
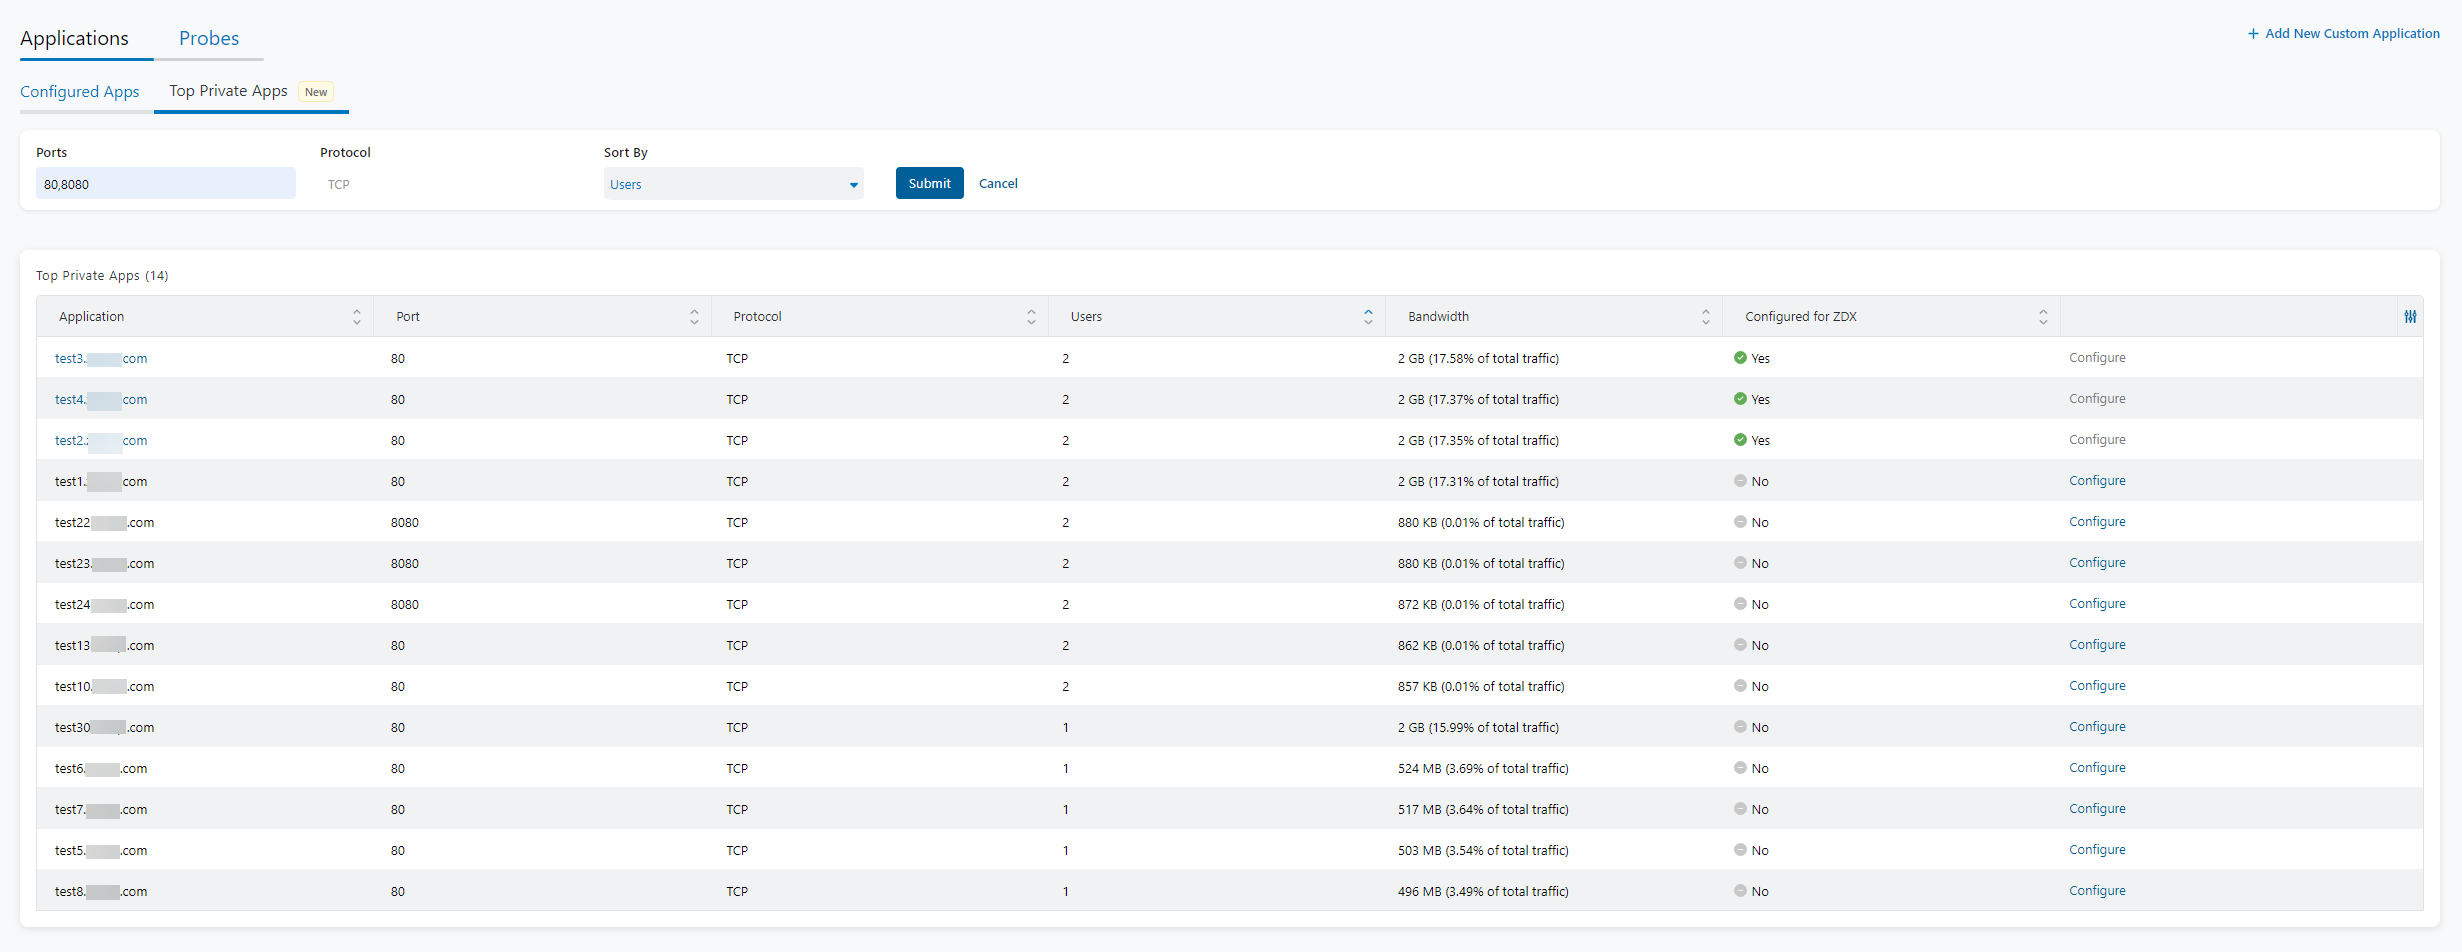
The list of Top Private Apps is created with readily available data from Zscaler Private Applications to provide an overview of the top private applications and a seamless probe configuration. You can search application data based on the port numbers that you enter and then sort by users or bandwidth. You can configure the private applications and their respective probes in the configuration wizard, which prepopulates with application information from Private Applications.
To view a list of Top Private Apps:
- Go to Policies > Digital Experience Monitoring > Configuration > Applications > Top Private Apps.
- Enter the port numbers that a private application uses. Separate each port number with a comma.
- Sort by users or bandwidth. The default is set to Users.
- Click Submit.
- For the list of top private applications, you can view:
- Applications: The name of the application.
- Port: The port number the application uses.
- Protocol: The type of protocol used.
- Users: The number of users using the application.
- Bandwidth: The bandwidth usage for multiple devices.
- Configured for ZDX: Provides status information if the application's probe configuration was enabled or configured on Digital Experience Monitoring.
- Configure: The option to configure the probing configuration.
If an application has the field Configured for ZDX set to Yes, then you cannot configure its probe configuration in the Top Private Apps page. You can access the probe configuration for the application in Configuration > Probes. To learn more, see Editing a Probe.
To configure a private application's probes on the Top Private Apps page:
- Select an application and click Configure.
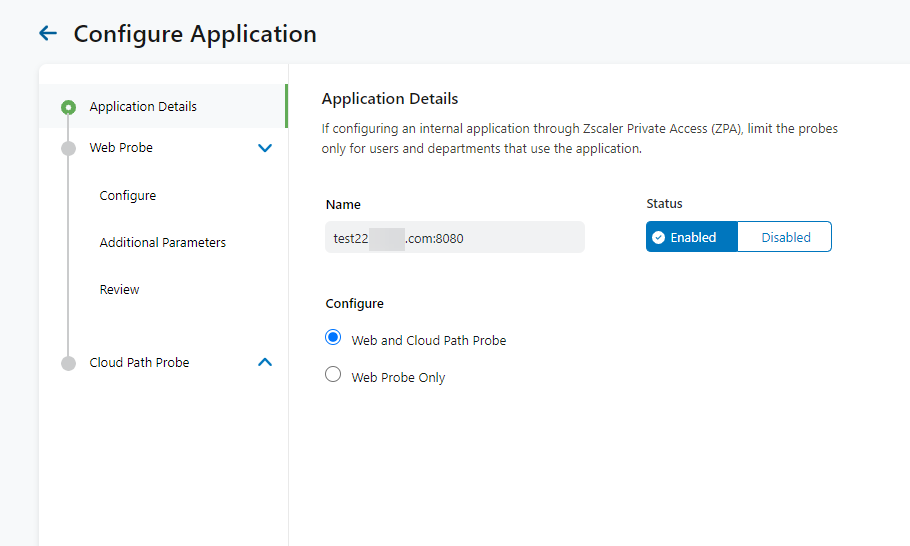
- On the Application Details tab, you can configure the following as required:
- Name: Enter the name of the application.
- Status: Enable or disable the application's probing status.
- Configure: Select which probing paths to use.
Click Next.
- For Web Probe:
- a. Configure Web Probe
- i. Configure General information.
- Name: Enter a name for the web probe.
- Status: Enable or disable the probe.
- Run Frequency (minutes): Enter the number of minutes for how frequently your probe should run. The default probe frequency varies based on your subscription plan. To learn more, see Ranges & Limitations.
You cannot configure the Application, Probe Type, or Probe Class.
Close - ii. Configure the Probing Criteria to include criteria for probe monitoring.
- Users: Select which users to include.
- User Groups: Select which user groups to include.
- Locations: Select which Zscaler locations to include.
- Departments: Select which departments to include.
- Devices: Select which devices to include.
- iii. Configure the Exclusion Criteria to exclude criteria from probe monitoring.
- Users: Select which users to exclude.
- User Groups: Select which user groups to exclude.
- Locations: Select which Zscaler locations to exclude.
- Departments: Select which departments to exclude.
- Devices: Select which devices to exclude.
Click Next.
Close - i. Configure General information.
- b. Additional Parameters
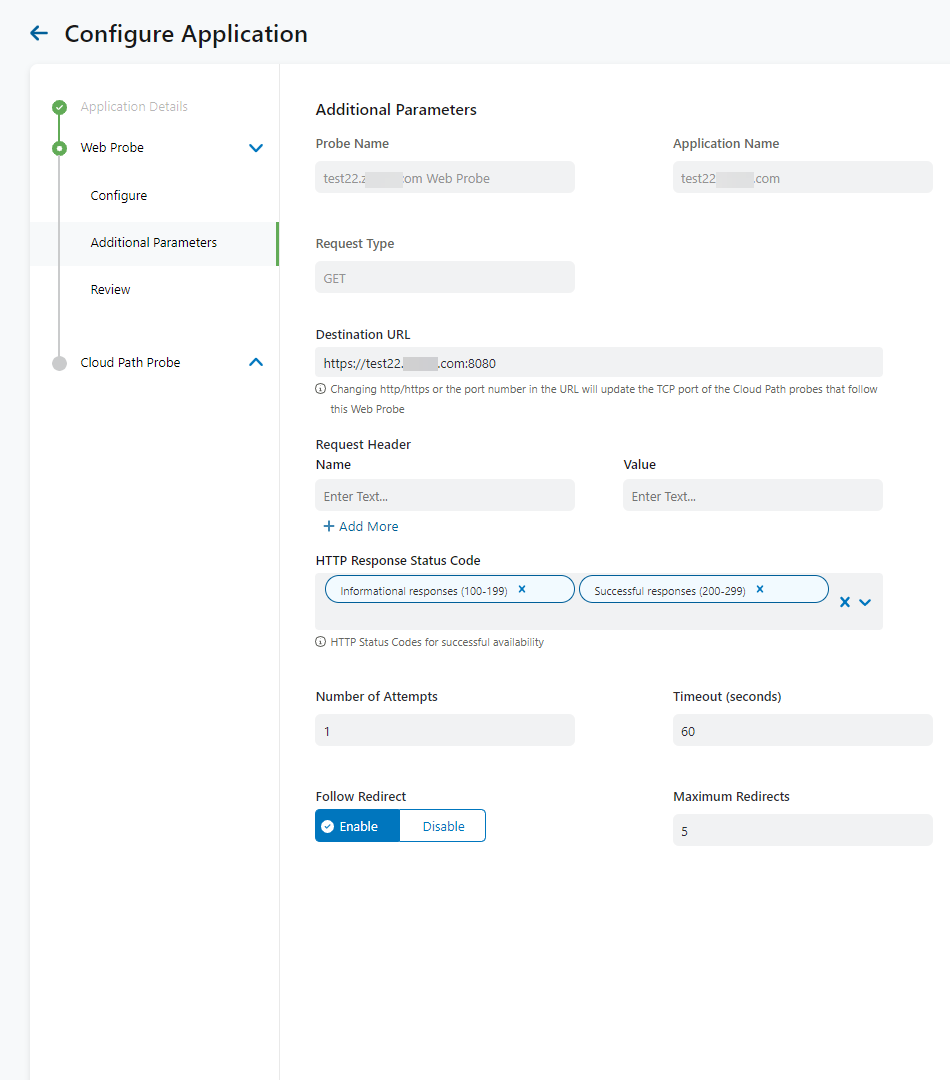
You cannot configure the Probe Name, Application Name, or Request Type.
You can configure the following:
- Destination URL: Enter the web destination, either an HTTP or HTTPS URL. This is the web address the probe requests. This is editable if the URL requires a tenant name.
- Request Header:
- Name: Enter the name of the request header.
- Value: Enter the value of the request header.
- Add More: Allows the option to add more than one name and value pair.
- HTTP Response Status Code: You can probe for specific HTTP Status Codes. You can add HTTP codes that are not in the default list by entering any number between the range of 100 to 499. By default, the following 1xx (Informational), 2xx (Success), and 3xx (Redirection) codes are applied:
- 100 Continue
- 101 Switching Protocol
- 102 Processing
- 103 Early Hints
- 200 OK
- 201 Created
- 202 Accepted
- 203 Non-Authoritative Information
- 204 No Content
- 205 Reset Content
- 206 Partial Content
- 207 Multi-Status
- 208 Already Reported
- 226 IM Used
- 300 Multiple Choices
- 301 Moved Permanently
- 302 Found
- 303 See Other
- 304 Not Modified
- 307 Temporary Redirect
- 308 Permanent Redirect
You can remove any of these codes by clicking the Close icon.
- Number of Attempts: The number of attempts before considering the monitor request failed. The default is 1 attempt, but can be increased.
- Timeout (seconds): The default is 60 seconds.
- Follow Redirect: Enable or disable this feature.
- Maximum Redirects: This specifies the number of times the probe attempts to follow the HTTP redirect before it is considered failed. The default is 5 redirects. If Follow Redirect is disabled, Maximum Redirects is also disabled.
Click Next.
Close - c. Review
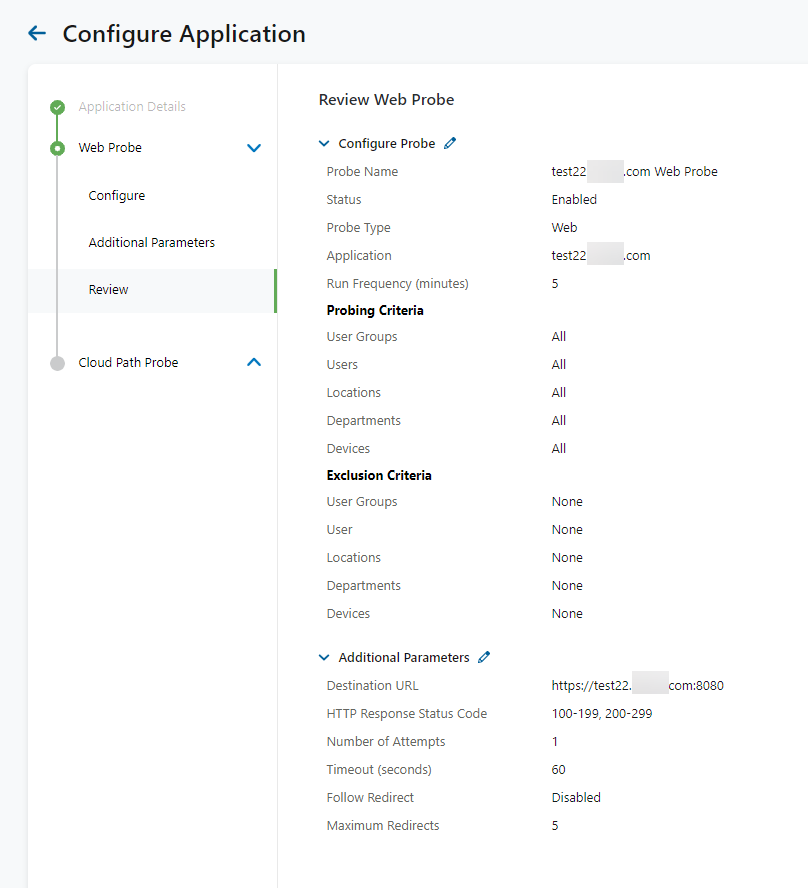
Review your Web Probe configuration, or you can edit any section as required.
Click Next to save your Web Probe configuration.
Close
- For Cloud Path Probe:
If you selected only the web probe in step 3, then you do not have the option to configure a Cloud Path Probe.
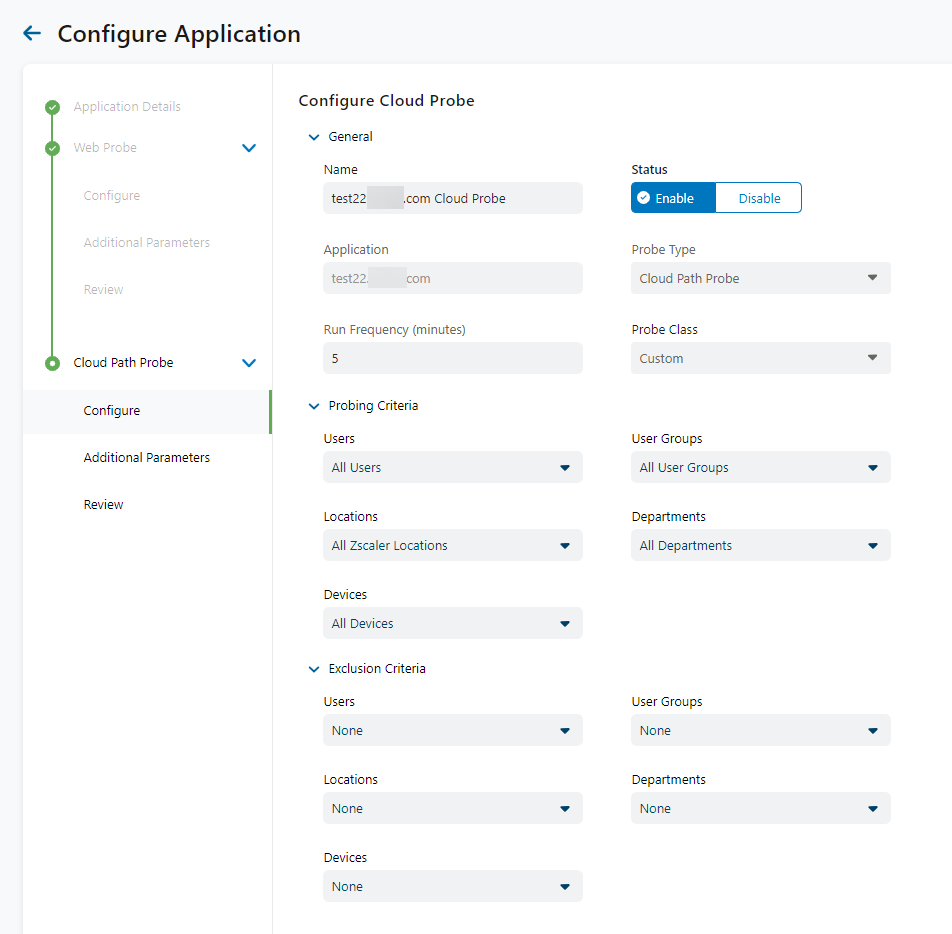
- a. Configure Cloud Path Probe
- i. Configure General information.
- Name: Enter a name for the Cloud Path probe.
- Status: Enable or disable the probe.
- Run Frequency (minutes): Enter the number of minutes for how frequently your probe should run. The default probe frequency varies based on your subscription plan. To learn more, see Ranges & Limitations.
You cannot configure the Application, Probe Type, or Probe Class.
Close - ii. Configure the Probing Criteria to include criteria for probe monitoring.
- Users: Select which users to include.
- User Groups: Select which user groups to include.
- Locations: Select which Zscaler locations to include.
- Departments: Select which departments to include.
- Devices: Select which devices to include.
- iii. Configure the Exclusion Criteria to exclude criteria from probe monitoring.
- Users: Select which users to exclude.
- User Groups: Select which user groups to exclude.
- Locations: Select which Zscaler locations to exclude.
- Departments: Select which departments to exclude.
- Devices: Select which devices to exclude.
Click Next.
Close - i. Configure General information.
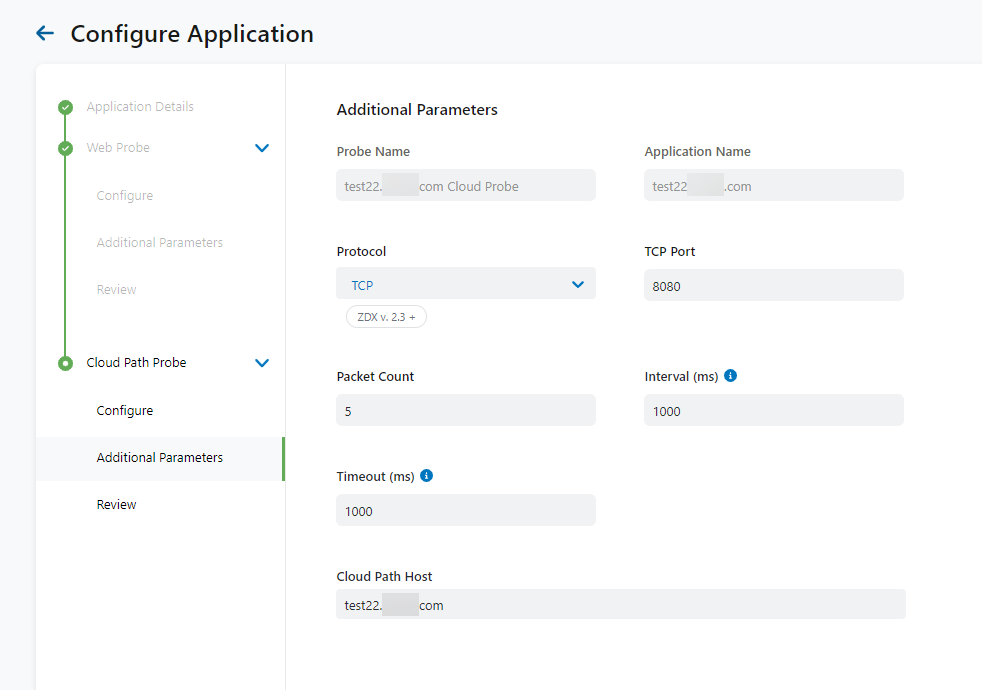
- b. Additional Parameters
You cannot configure the Probe Name or Application Name.
You can configure the following:
- Protocol: Select a protocol from the drop-down menu. Options include Adaptive, ICMP, TCP, and UDP.
- TCP Port: If you choose TCP as the protocol, this field is automatically displayed and populated with the standard TCP Port for HTTPS traffic, 443, though this can be edited.
- Packet Count: The number of probe packets sent per hop discovery that have the same TTL value. The default is 5 packets, the maximum is 20 packets, and the minimum is 3 packets.
For Private Applications, the recommended packet count is 3 packets, and the maximum is 6 packets.
- Interval (ms): The time interval between probe packets with the same TTL. Probe packets of incremental TTL are paced evenly within this time interval. The number of iterations or cycles is defined by the configured Packet Count. The default is 1000, the minimum is 1000, and the maximum is 10000.
- Timeout (ms): The time to wait for a response to a probe packet before considering loss. The default is 1000, the minimum is 500, and the maximum is 5000. The recommended setting for Private Applications is 500.
- Cloud Path Host: The tenant name or fully qualified domain name for the host (i.e., the IPv4 IP address; IPv6 is not supported). Zscaler partially provides the domain name if the application selected is predefined. This is editable if a tenant name is required.
Click Next.
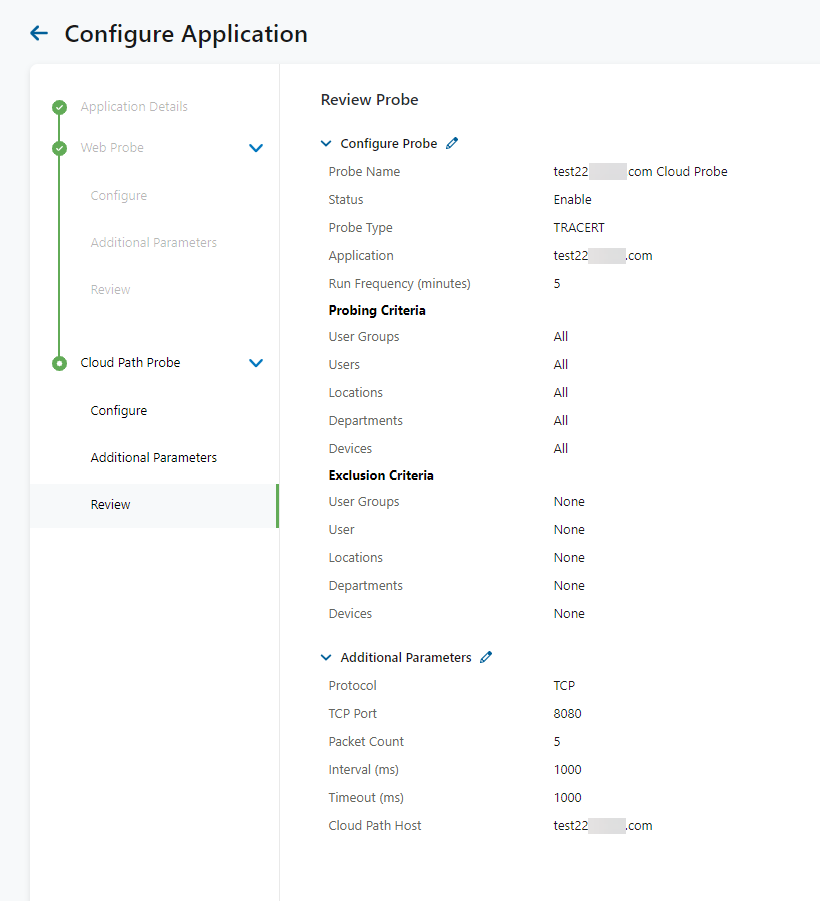
Close - c. Review
Review your Cloud Path Probe configuration or edit any field as required.
Close
- Click Submit to save all of your configurations.
- Activate the changes.
To learn more about configuring a probe, see Configuring a Probe.

