Experience Center
About Email Security Report: Incidents
The Email Security Report: Incidents page gives visibility and insight into your organization's Email Data Loss Prevention (DLP) traffic for all the incidents.
The Email Security Report: Incidents page provides the following benefits and enables you to:
- Gain visibility into your organization's Email DLP incidents.
- Analyze Email DLP incidents in your organization from different perspectives (e.g., severity, action taken on the activity, domains, etc.)
About the Email Security Report: Incidents Page
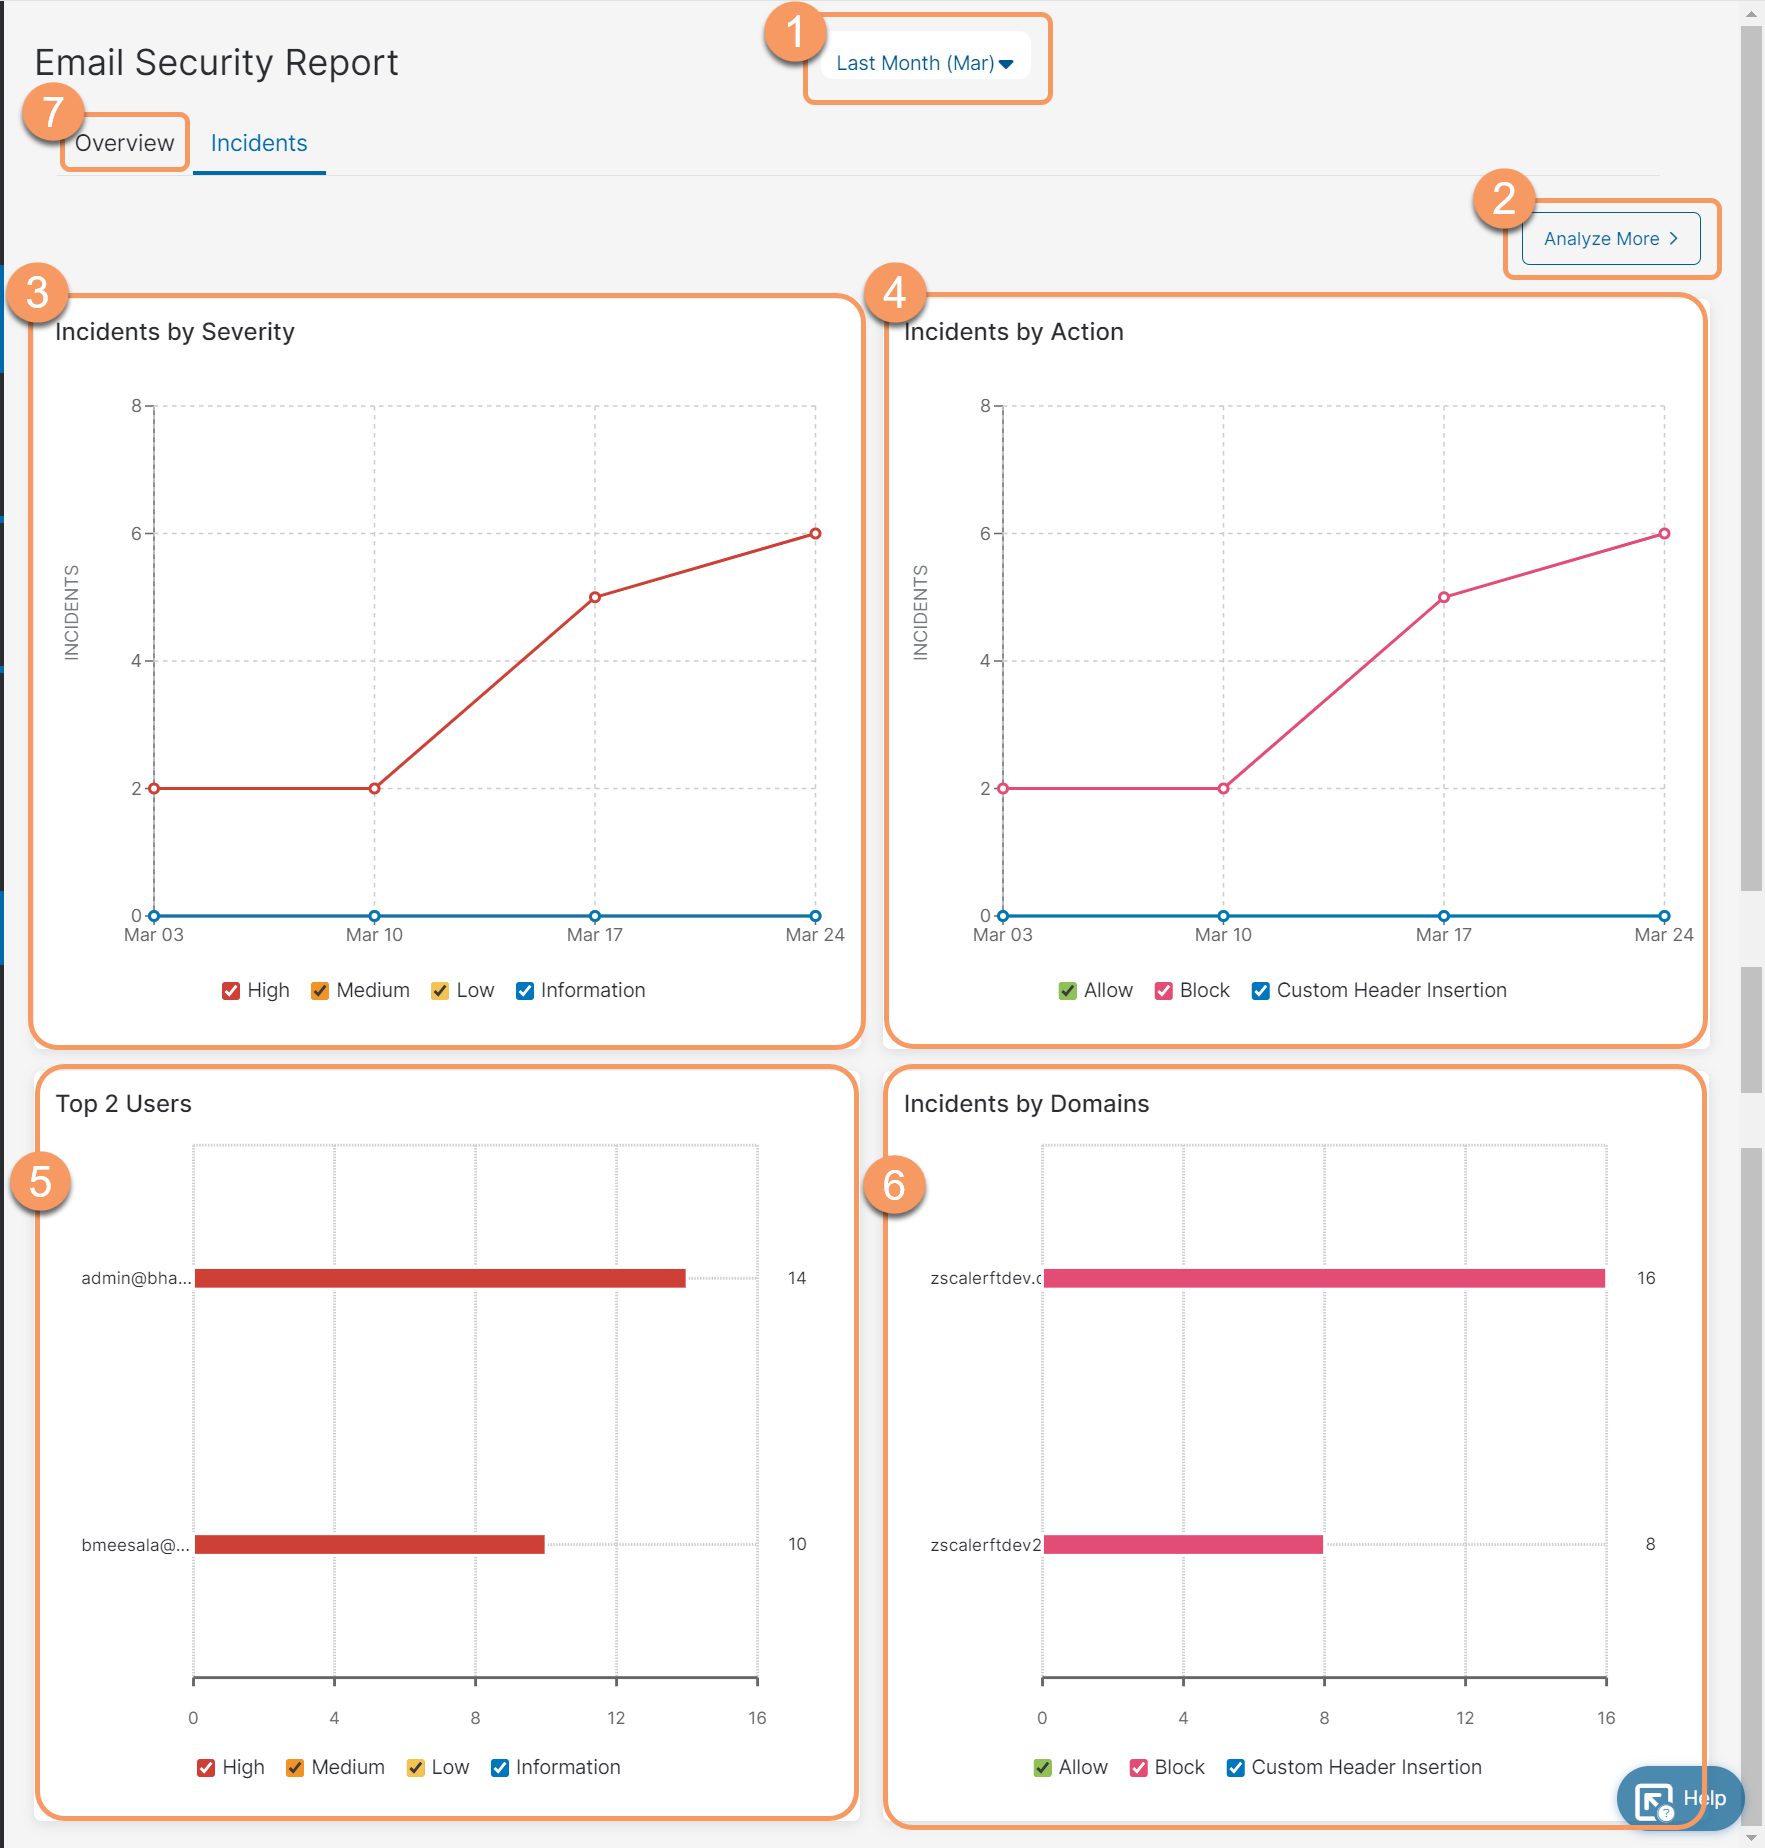
On the Email Security Report: Incidents page (Analytics > Internet & SaaS > Analytics > Email Security Reports > Incidents), you can do the following:
- Filter the report for the last 1 day, 7 days, or month.
- Analyze More: Further analyze the incidents in a detailed view.
- Detailed View
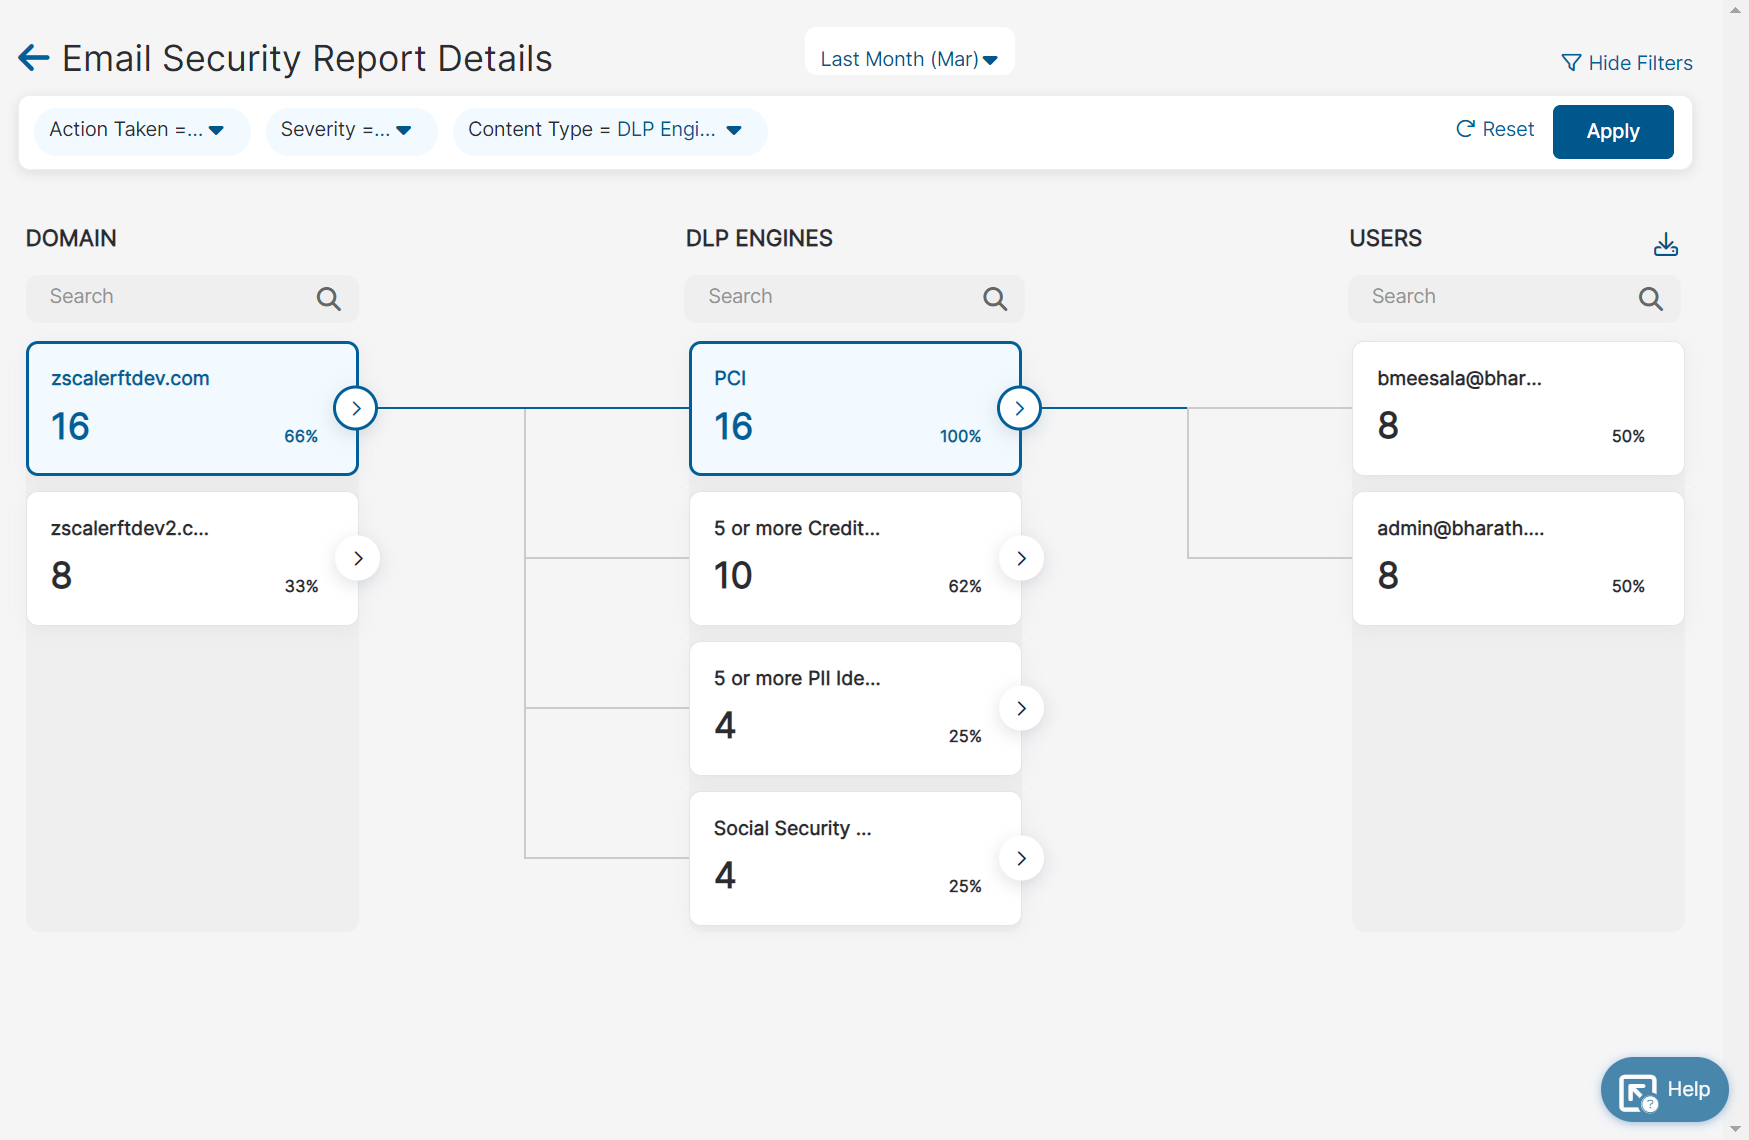
The detailed view is divided into three columns; Domain, Content Type (DLP Dictionaries, DLP Engines, or ML Categories), and Users. To drill down for specific data:
- Select the time period for which you want to see the data. You can select for the last 1 day, 7 days, or last month.
- Filter the data for specific action taken, severity, or content type. You can choose to show or hide filters from the top right of the page.
The Domain column populates the data determined by your selections. Each domain tile shows the number of incidents generated by them and their percentage contribution to the total incidents generated by the domain.
- Select the domain for which you want to view the data.
The Content Type (DLP Dictionaries, DLP Engines, or ML Categories) column is updated for the selected domain. Each content type tile shows the number of incidents discovered by them and their percentage contribution to the total incidents discovered by the content type.
- Select the content type for which you want to further drill down the data.
The Users column is updated for the selected content type. Each user tile shows the number of incidents by the user and the percentage contribution to the total incidents generated by all the users.
When you right-click and select Show in Logs in the Domain, Content Type (DLP Dictionaries, DLP Engines, or ML Categories) or Users tile, you are redirected to the Insights Logs page.
The values shown in the Email Security Report page and the Insights Logs page might vary, as the values in the Email Security Report Details page are tracked per recipient, but the logs in the Insights Logs are tracked per mail, and each email can contain multiple recipients.
Additionally, you can click the Download icon (
Close.png) ) to export any column data to a comma-separated value (CSV) file. When you select an item in a column, the option to export as a CSV file is no longer available for that column.
) to export any column data to a comma-separated value (CSV) file. When you select an item in a column, the option to export as a CSV file is no longer available for that column.
- Detailed View
- Incidents by Severity: View incidents for each of the severity types (High, Medium, Low, or Information) for the overall recipients. For example, if an email was sent to 10 recipients and all the recipients triggered different outbound email policy rules with High severity, then the severity is counted as 10 for High. Hover over a date to view the number of incidents for each severity for that date. You can choose to view the graph for specific severities from the bottom of the graph. By default, all severities are selected.
- Incidents by Action: View incidents for each action (Allow, Custom Header Insertion, or Block) for the overall recipients. For example, if on a given day an email was sent to 10 recipients which triggered different outbound email policy rules, then the corresponding actions (5 blocked and 5 allowed) taken by the Zscaler server are displayed in the graph. Hover over a date to view the number of incidents for each action for that date. You can choose to view the graph for specific actions from the bottom of the graph. By default, all actions are selected.
- Top Users: View the top users generating the incidents. The number of users displayed in this section depends on the number of incidents generated by the users. You can see the total number of incidents generated by each user. Hover over the severity bars to view the number of incidents generated for each severity by the users. You can choose to view the graph for specific severity from the bottom of the graph. By default, all severities are selected.
- Incidents by Domains: View incidents by domains. You can see the total number of incidents for each domain. Hover over the action bars to view the number of incidents by each action. You can choose to view the graph for specific action from the bottom of the graph. By default, all actions are selected.
- Go to the Overview page.

