Experience Center
About Live Logs
You can view and filter user activity, user status, application activity, and App Connector status data for real-time events. If you need to view past events for this data, use Diagnostics.
Accessing Live Logs
To view real-time events and log data for user activity, user status, application activity, and App Connector status:
- Go to the Live Logs page (Logs > Insights > Live Logs).
- Under Mode, choose one of the following options:
- User: If selected, under Log Type, choose one of the following options:
- Activity: Displays the User Activity page, which contains detailed user activity data for all users.
- Status: Displays the User Status page, which contains detailed user status and authentication data for all users.
- Application: Displays the Application Activity page, which contains detailed activity for all the applications that users have accessed or requested access to.
- App Connector Status: Displays the App Connector Status page, which contains detailed activity for App Connectors and Public Service Edges.
- Private Service Edge Status: Displays the Private Service Edge Status page, which contains detailed activity for your organization's Private Service Edges.
- User: If selected, under Log Type, choose one of the following options:
After a Mode is selected, you can view and further filter the Live Log data within the page.
Zscaler retains User Activity, User Status, and App Connector log information for rolling periods of at least 14 days during the subscription term. Zscaler retains Audit log information for at least 6-month periods during the subscription term. You can also view your logs or stream logs in real time using the Log Streaming Service (LSS).
Viewing User Activity Real-Time Events and Logs
On the User Activity page (Logs > Insights > Live Logs and select Mode: User and Log Type: Activity), you can:
- View User Activity Real-Time Events
You can see live user activity within the chart. When users request access to applications, the Public Service Edges or Private Service Edges record the data and send the user activity logs to Private Applications.
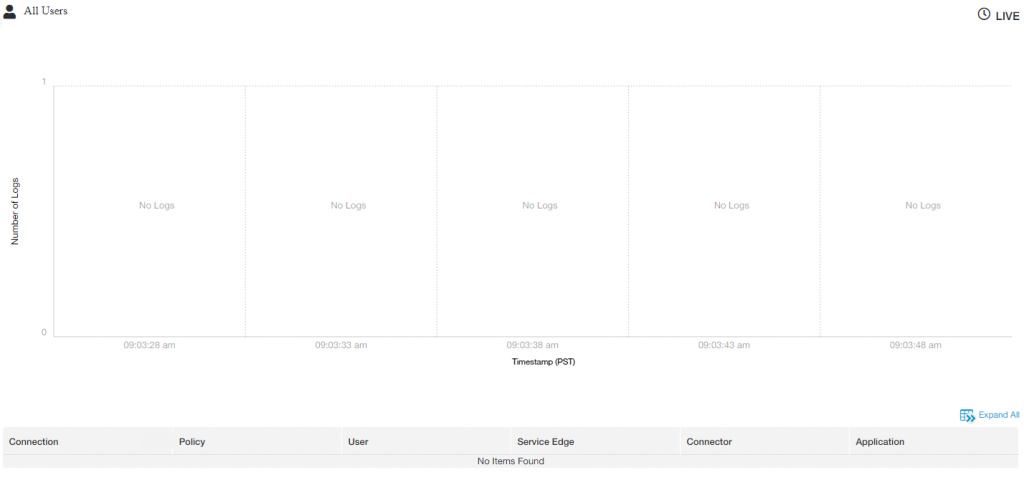
The chart streams the number of user activity logs as well as the time that the event took place.
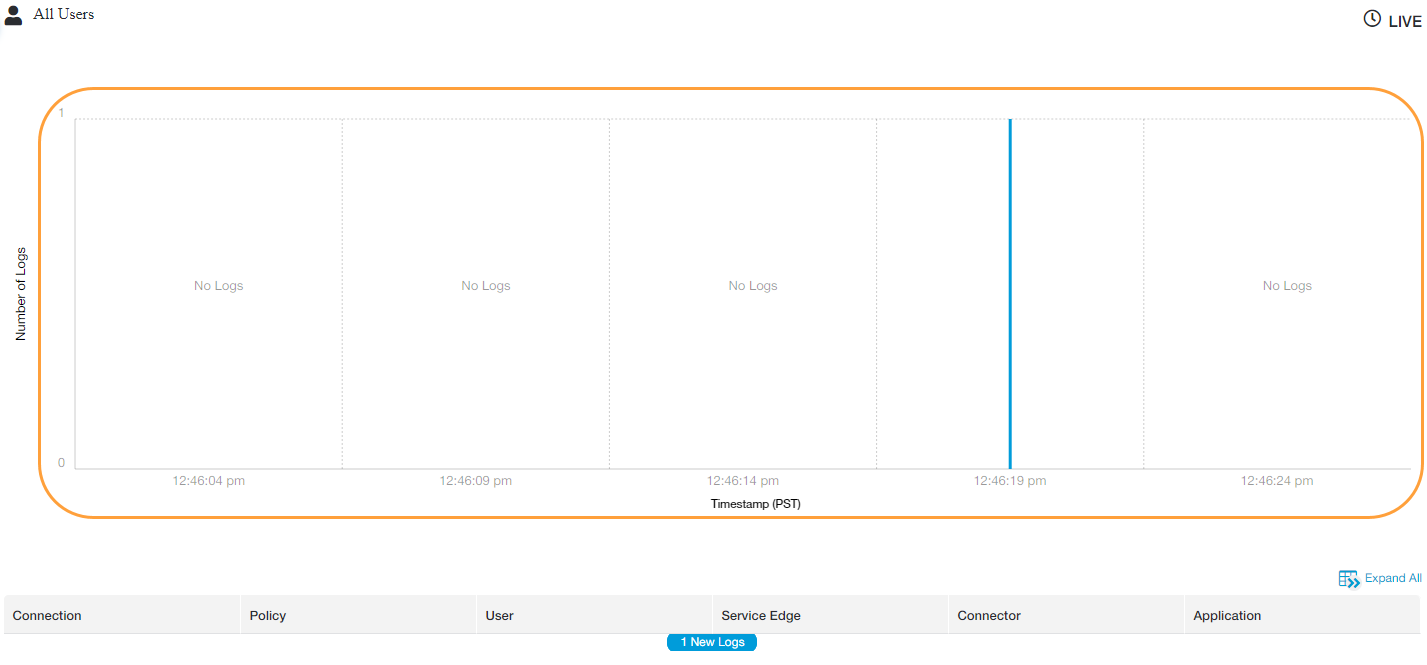
The chart tracks up to 100 of the latest activity logs. It updates instantaneously when the Public Service Edges or Private Service Edges record new logs. By default, the table doesn't display any data. Click New Logs to populate the table. Every time you click New Logs the table refreshes, removing the older logs displayed with the newest.

If you have many applications, users, and App Connectors configured for your organization, the Real-Time Events table might potentially produce a lot of logs. When troubleshooting, Zscaler recommends filtering the logs by User and Application to avoid viewing irrelevant logs.
Close - View User Activity Live Logs
The table displays the following data for application requests. You can expand each request to see even more data. The data within the Live Logs table is streamed in real time from the Public Service Edges or Private Service Edges.
- Connection
The Connection column sorts requests by the connection date and start time in descending order. The time displayed is based on the time you choose for your account setting in the Admin Portal.
- Log Time: The time the connection was logged.
- Start Time: The time the connection started.
- End Time: The time the connection ended.
- Status Code: The status of the application request. For errors and policy blocks, you can click the session status name to learn more about it. To see a complete list of session statuses, see Session Status Codes.
- Internal Status Code: The internal status reason. You can click the Copy icon to copy the internal reason to your clipboard. This field only applies to errors and policy blocks. To see a complete list of internal reasons per session status, see Session Status Codes.
- Status: Displays one of the following connection states:
- Open Connection
 : The user is currently connected to the application.
 - Active Connection
 : The user is currently using the application.
 - Closed Connection
 : The user's session has ended.
- Open Connection
- Duration: The duration of the connection to the application.
- Total Bytes: The total bytes (B) and kilobytes (KB) of the request and the response, respectively.
- Connection ID: The ID associated with the application request. You can click the Copy icon to copy the ID to your clipboard.
- Connection Type: The connection type of the user request. By default, the Connection Type is set to Private Applications.
- Access Type: The access type associated with the request. This field is only visible when the Access Type is Client to Client.
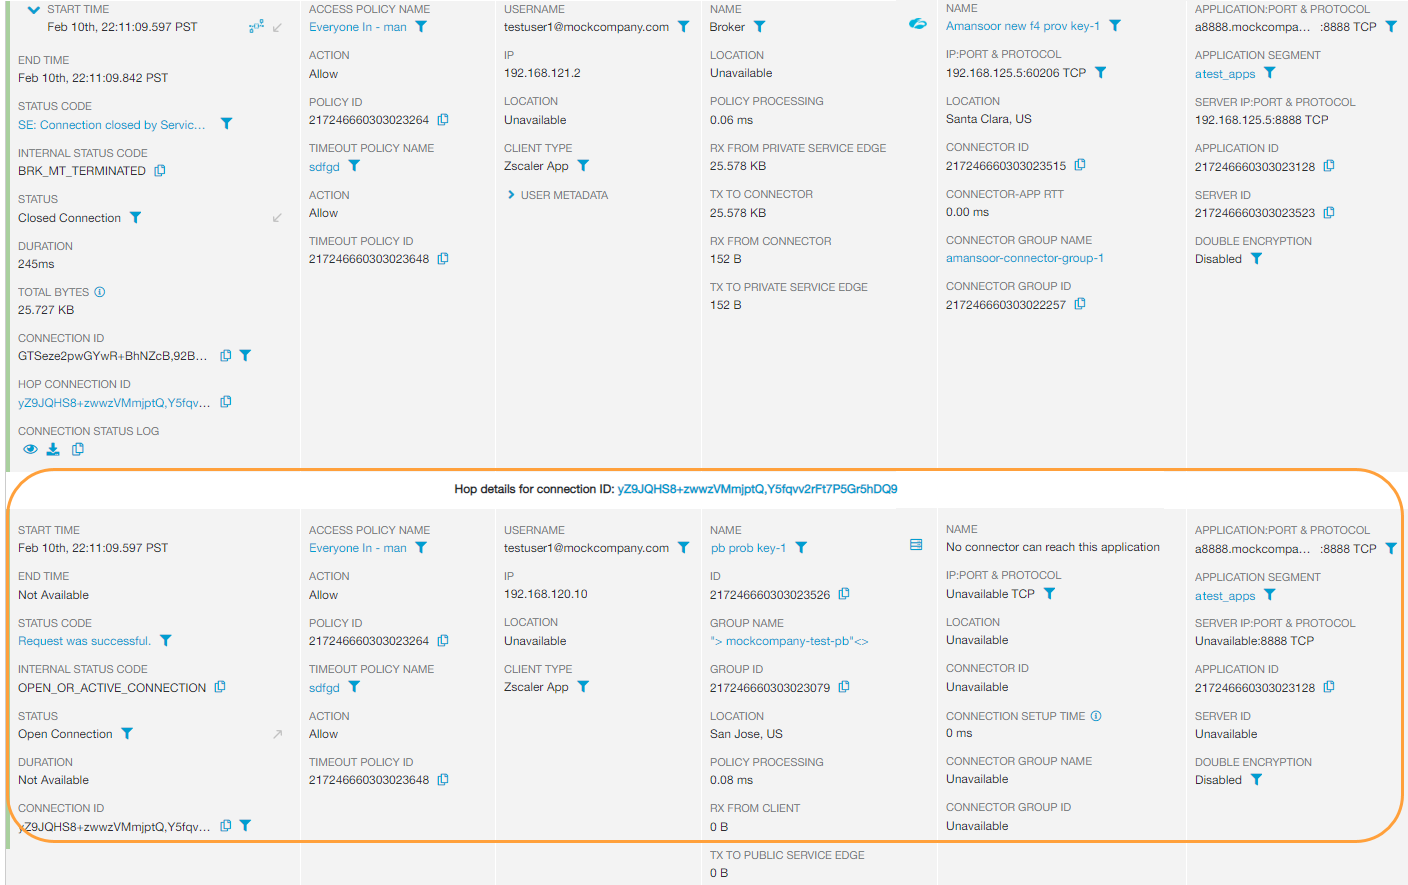
- Hop Connection ID: The ID associated with the connection hop. Connections without a hop do not show this ID. You can click the Copy icon to copy the ID to your clipboard.
A hop occurs when a user's request was forwarded to a Public Service Edge as the App Connector was not able to reach the Private Service Edge. (This is the first part of the hop, and the log information is what appears for the connection.) The Private Service Edge then forwards the request to a Public Service Edge. The is the second part of the hop.
You can click the link to view the log details for the second part of the hop. They appear below the session log.
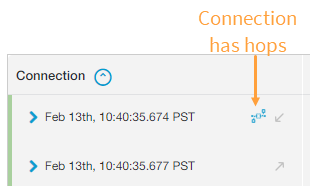
If there is a hop in the connection, it shows a hop icon.
- Connection Status Log: View, download, and copy the raw JSON for the request:
- Click the View Log icon to display the Raw JSON for the request within the Admin Portal.
- Click the Download icon to download the raw JSON for the request to a text (.txt) file.
- Click the Copy icon to copy the raw JSON text for the request to your clipboard.
You can also click the Copy icon or click View Log to copy or see the raw JSON for the request.
Close - Policy
- Access Policy Name: The access policy name as configured in the Admin Portal. You can click on the name to open the Edit Access Policy window.
- Policy ID: The ID associated with the access policy. You can click the Copy icon to copy the ID to your clipboard.
- Timeout Policy Name: The timeout policy name as configured in the Admin Portal. You can click on the name to open the Edit Timeout Policy window.
- Action: Whether the access or timeout policy allowed or denied the user access to the application.
- Timeout Policy ID: The ID associated with the timeout policy. You can click the Copy icon to copy the ID to your clipboard.
- User
- Username: The user who requested the application. This is the NameID in the SAML assertion from the IdP and not the username entered in Zscaler Client Connector.
If you are using the Log Streaming Service (LSS), be aware that the Private Applications LSS Client user represents the LSS service, not an actual user. By default, Diagnostic information for the Private Applications LSS Client is captured but not displayed. You must explicitly select this user from the User field to display its log information. Also, each log receiver is displayed as an application, to reflect the data coming in from the service. To learn more, including how to stop the service from capturing Private Applications LSS Client logs, see Configuring a Log Receiver.
- IP: The IP address of the user's device.
- Location: The city and country the user is connecting from. If Private Applicaitons are unable to determine the user's location, then the private IP is shown.
- Client Type: The name of the client the user's device is connecting from (i.e., Branch Connector, Zscaler Client Connector, Client Connector Partner, Web Browser, Web Browser Unauthenticated, or Internet & SaaS Public Service Edge).
- Service Edge
- Name: The name of the Public Service Edge or Private Service Edge used to connect the application to the user. You can click on the name to open the Edit Service Edge window.
- ID: The internal ID for a Private Service Edge for the connection request to the application. You can click the Copy icon to copy the ID to your clipboard.
- Group Name: The name of the group the Private Service Edge is included in. You can click on the name to open the Edit Service Edge Group window.
- Group ID: The internal ID for the Private Service Edge group. You can click the Copy icon to copy the ID to your clipboard.
- Location: The location of the Public Service Edge or Private Service Edge used to connect the application to the user.
- App Connector
- Name: The name of the App Connector used to connect the application to the user. You can click on the name to open the Edit Connector window.
- IP:Port & Protocol: The IP address, port, and protocol of the App Connector.
- Application
- Application:Port & Protocol: The fully qualified domain name (FQDN) or the IP address, port, and protocol of the application. This field might also show the names and IDs of the applications with Multimatch enabled. To learn more, see Configuring Defined Application Segments.
- Application Segment: The application segment name as configured in the Admin Portal. You can click on the name to open the Edit Application Segment window, which includes the defined application. This field might also show the names and IDs of the applications with Multimatch enabled. To learn more, see Configuring Defined Application Segments.
- Server IP:Port & Protocol: The IP address, port, and protocol of the server that hosts the application.
- Application ID: The ID associated with the application. You can click the Copy icon to copy the ID to your clipboard.
- Server ID: The ID associated with the server. You can click the Copy icon to copy the ID to your clipboard.
- Double Encryption: Lists whether Double Encryption is enabled or disabled for the application.
- Connection
- Filter User Activity Live Logs
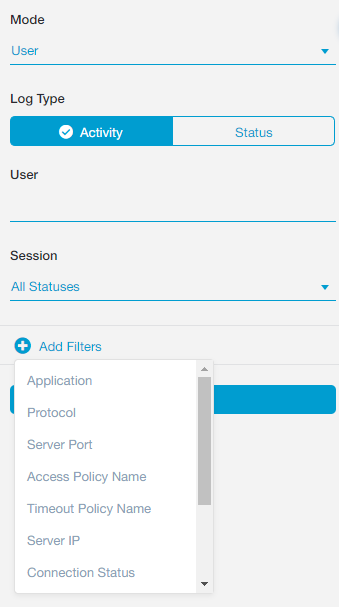
For Live Log real-time events, you can use the default filters on the left and filter requests by:
- User: See requests for a particular username. This is the NameID in the SAML assertion from the IdP and not the username entered in Zscaler Client Connector.
If you are using the Log Streaming Service (LSS), be aware that the Private Applications LSS Client user represents the LSS service, not an actual user. By default, Diagnostic information for the Private Applications LSS Client is captured but not displayed. You must explicitly select this from the User field to display its log information. Also, each log receiver is displayed as an application, to reflect the data coming in from the service. To learn more, including how to stop the LSS service from streaming Private Applications LSS Client logs, see Configuring a Log Receiver.
- Session: See requests that resulted in a specific status. To see a list of all status codes, see Session Status Codes.
Click Add Filters to add any of the following filters with the default ones:
- Application: See requests for a specific application. Enter the FQDN or IP address of the application.
- Protocol: See requests for connections using a specific protocol.
- Access Type: Client to Client: See requests for whether the domain being accessed by Zscaler Client Connector allows client-to-client communication or not.
- Server Port: See requests for connections using a specific port.
- Access Policy Name: See requests that triggered a specific access policy.
- Timeout Policy Name: See requests that triggered a specific timeout policy.
- Server IP: See requests with connections to applications hosted by a server at a specific IP address.
- Connection Status: See requests with Open, Active, or Closed connections.
- User IP: See requests from a specific device IP address.
- Service Edge: Name (Public/Private): See requests with connections through a specific Public Service Edge or Private Service Edge.
- Client Type: See requests by the client type the user's device is connecting from (i.e., Branch Connector, Zscaler Client Connector, Client Connector Partner, Web Browser, Web Browser Unauthenticated, or Internet & SaaS Public Service Edge).
- Connection ID: See requests by the ID associated with the application request.
- User: Session Type: See requests by the session type of the user (DTLA or TLS).
- App Connector: Session Type: See requests by the session type of the App Connector (DTLS or TLS).
- From a Microtenant: See requests by the Microtenant that belongs to the application segment.
- Within Shared Microtenant: See requests by the Microtenants that the application segment has been shared to.
After you've chosen your filters, click Update to apply them.
Close
Viewing User Status Real-Time Events and Logs
On the User Status page (Logs > Insights > Live Logs and select Mode: User and Log Type: Status), you can:
- View User Status Real-Time Events
You can see live user status and authentication activity within the chart. When users authenticate, the Public Service Edges or Private Service Edges record the data and send the authentication logs to Private Applications
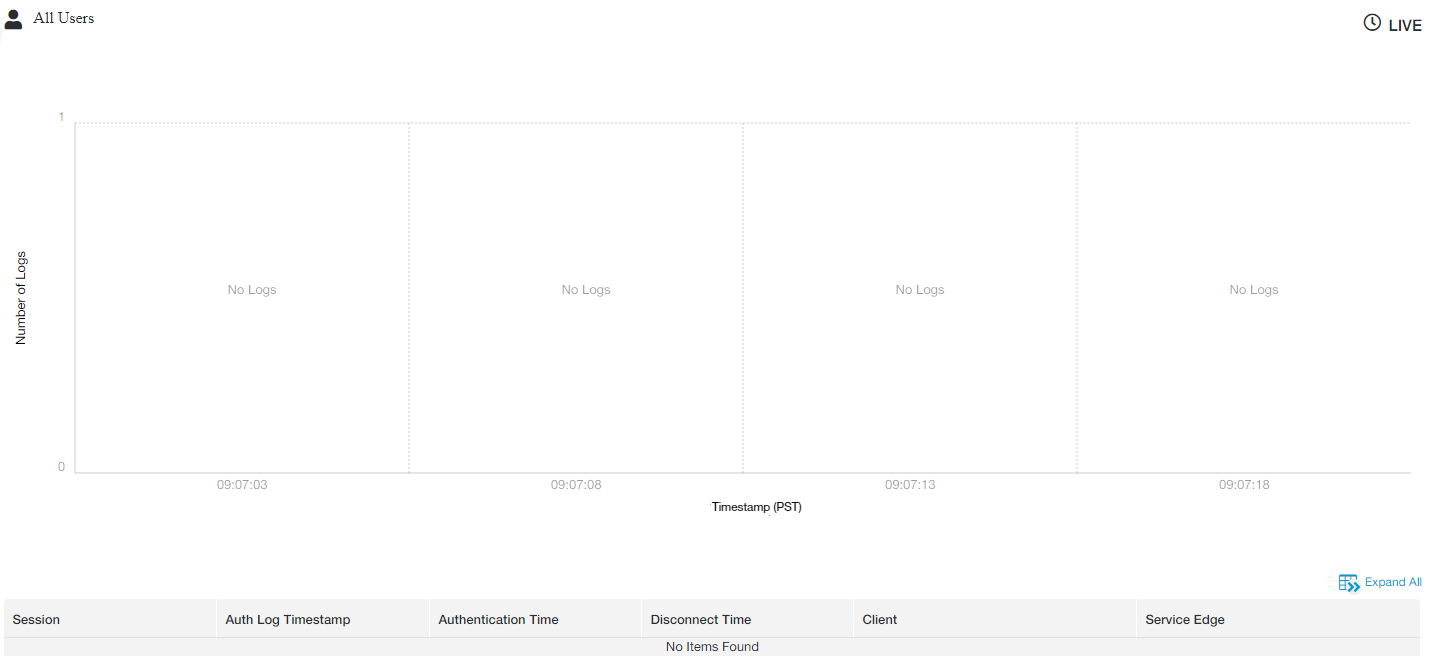
The chart streams the number of user authentication logs as well as the time that the event took place.
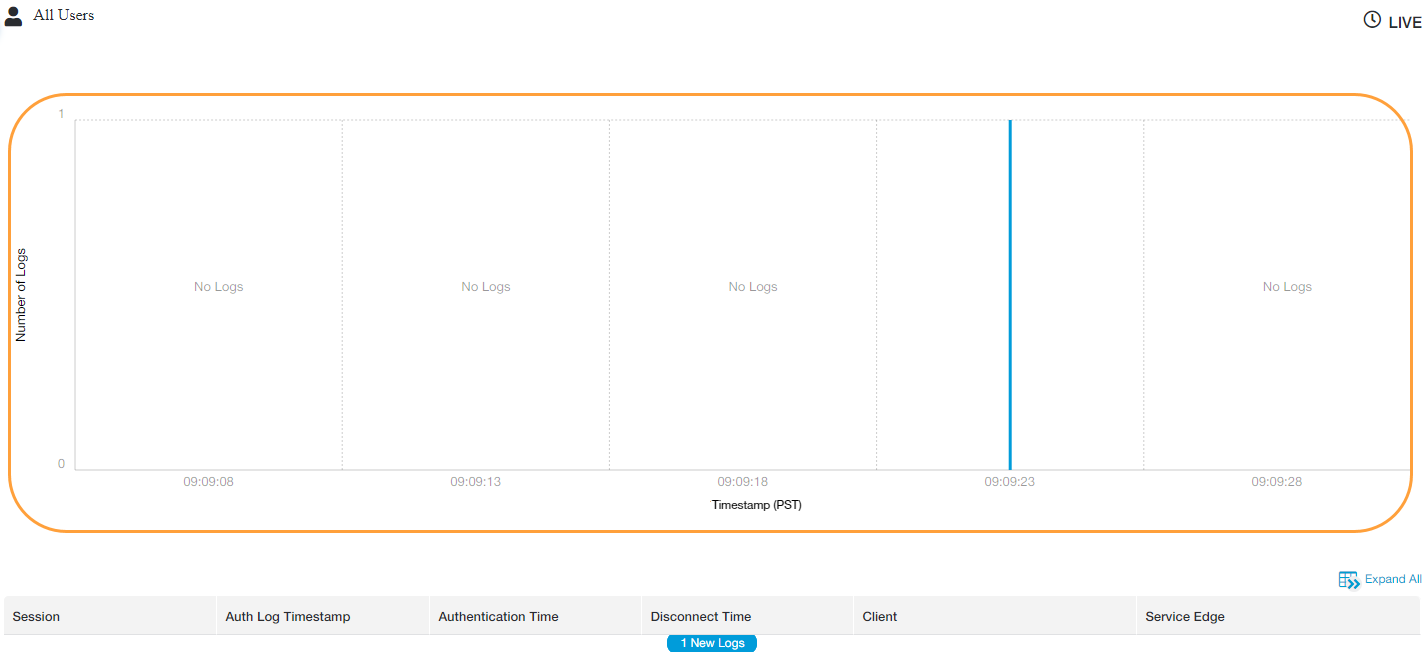
The chart tracks up to 100 of the latest user authentication logs. It updates instantaneously when the Public Service Edges or Private Service Edges record new logs. By default, the table doesn't display any data. Click New Logs to populate the table. Every time you click New Logs the table refreshes, removing the older logs displayed with the newest.
Close
- View User Status Live Logs
The table displays the following data about user authentication activity. You can expand each request to see even more data. The data within the Live Logs table is streamed in real time from the Public Service Edges or Private Service Edges.
- Session
Displays one of the following session status codes:
- Authenticated: The user successfully authenticated
- Authentication Failed: The user was unable to authenticate
- Disconnected: The user successfully disconnected
For every session status, the following fields are displayed:
- Client Type: The type of the client the user's device is connecting from.
- Client Version: The version number of the client.
- Connection ID: The ID associated with the application request. You can click the Copy icon to copy the ID to your clipboard.
- Connection Status Log: View, download, and copy the raw JSON for the request:
- Click the View Log icon to display the Raw JSON for the request within the Admin Portal.
- Click the Download icon to download the raw JSON for the request to a text (.txt) file.
- Click the Copy icon to copy the raw JSON text for the request to your clipboard.
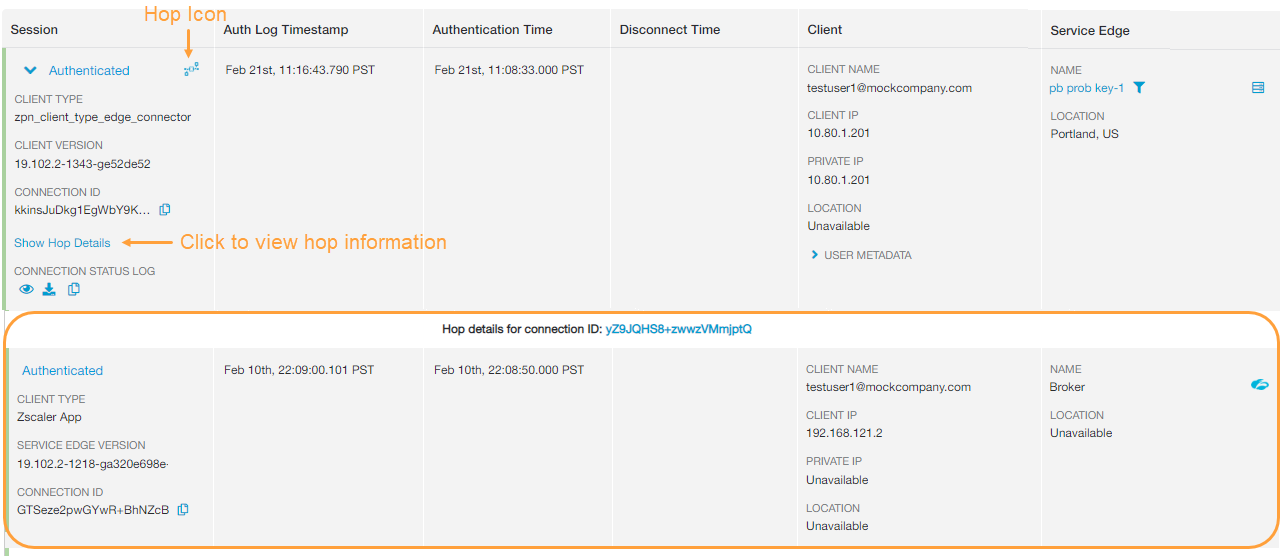
For session statuses that contain hop details, additional information is displayed. A hop icon appears next to the session status code and Show Hop Details appears with the other session status fields. There are two parts to every hop: the user's Zscaler Client Connector connecting to a Private Service Edge and then the Private Service Edge connecting to a Public Service Edge. The first part are the logs that already appear for the session. You can click the link to view the log details for the second part of the hop. They appear below the session log.
Close - Auth Log Timestamp
The data and time when the log was generated. The column sorts requests by the date and start time in descending order and in the time you choose for your account setting in the Admin Portal.
Close - Authenticaton Time
The time that the user authenticated. The column displays requests in the time you choose for your account setting in the Admin Portal and sorts requests based on the Auth Log Timestamp column date and time.
Close - Disconnect Time
The time that the user disconnected. The column displays requests in the time you choose for your account setting in the Admin Portal and sorts requests based on the Auth Log Timestamp column date and time.
Close - Client
If you are using the Log Streaming Service (LSS), be aware that the Private Applications LSS Client user represents the LSS service, not an actual user. By default, Diagnostic information for the Private Applications LSS Client is captured but not displayed. You must explicitly select this user from the User field to display its log information. Also, each log receiver is displayed as an application, to reflect the data coming in from the service. To learn more, including how to stop the LSS service from streaming Private Applications LSS Client logs, see Configuring a Log Receiver.
- Client IP: The IP address for the client accessing the application.
- Private IP: The private IP address of the user's device.
- Location: The city and country the user is connecting from. If Private Applications are unable to determine the user's location, then the Private IP is shown.
- User Metadata:
- IdP Name: The name of the IdP configured in the Admin Portal.
- IdP ID: The ID associated with the IdP.
- SAML Attributes: View, download, and copy the SAML attributes related to the request:
- Click the View Log icon to display the SAML attributes and values within the Admin Portal.
- Click the Download icon to download the SAML attributes to a text (.txt) file.
- Click the Copy icon to copy the SAML attributes to your clipboard.
- SCIM Users: The user that is provisioned for SCIM.
- SCIM Groups: The group that is provisioned for SCIM.
- Hostname: The hostname that the user's device is on.
- Platform: The platform the user's device is on
- Client Connector Trusted Networks: The names of the trusted networks accessible by the user's device.
- Posture Profiles Verified: If Zscaler Client Connector verified the user's device against the criteria specified in the posture profile, then TBD is displayed for this field.
- Posture Profiles Unverified: If Zscaler Client Connector was unable to verify the user's device against the criteria specified in the posture profile, then TBD is displayed for this field.
- External Device ID: See logs from users with the identifier that associates an external MDM device ID with devices in the Zscaler Client Connector Portal.
- Service Edge
- Name: The name of Public Service Edge or Private Service Edge used to connect the user to the application.
Depending on who hosts the Service Edge (Zscaler or your organization), a different icon appears with the Service Edge name.
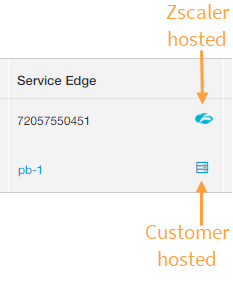
As part of setting up the TLS session, the Zscaler hosted Public Service Edge directs the user's Zscaler Client Connector to connect with a Private Service Edge at a particular location. When this happens, a redirect icon ( ) appears next to the name instead of one of the other Service Edge icons above.
- Location: The location of the Public Service Edge or Private Service Edge used to connect the user to the application.
- Session
- Filter User Status Live Logs
For Live Log real-time events, you can use the default filters on the left panel and filter requests by:
- User: See events for a particular username. This is the NameID in the SAML assertion from the IdP and not the username entered in Zscaler Client Connector.
If you are using the Log Streaming Service (LSS), be aware that the Private Applications LSS Client user represents the LSS service, not an actual user. By default, Diagnostic information for the Private Applications LSS Client is captured but not displayed. You must explicitly select this user from the User field to display its log information. Also, each log receiver is displayed as an application, to reflect the data coming in from the service. To learn more, including how to stop the LSS service from streaming Private Applications LSS Client logs, see Configuring a Log Receiver.
- Session: See events that resulted in a specific status.
Click Add Filters to add any of the following filters with the default ones:
- Client Type: See events by the client type the user's device is connecting from (i.e., Branch Connector, Zscaler Client Connector, Client Connector Partner, Web Browser, Web Browser Unauthenticated, or Internet & SaaS Public Service Edge).
- User IP: See events from a specific device IP address.
- Service Edge: Name (Public/Private): See events with connections made by a specific Public Service Edge or Private Service Edge.
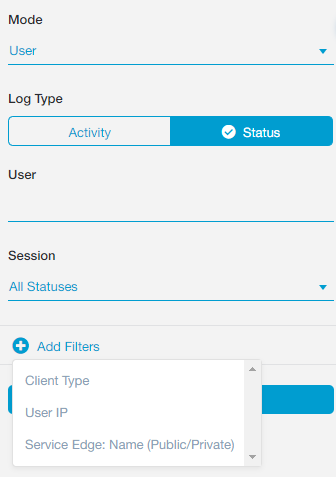
After you've chosen your filters, click Update to apply them.
Close
Viewing Application Activity Real-Time Events and Logs
On the Application Activity page (Logs > Insights > Live Logs and select Mode: Application), you can:
- View Application Activity Real-Time Events
You can see live application activity within the chart. When users request or access applications, the Public Service Edges or Private Service Edges record the data and send the logs to Private Applications.
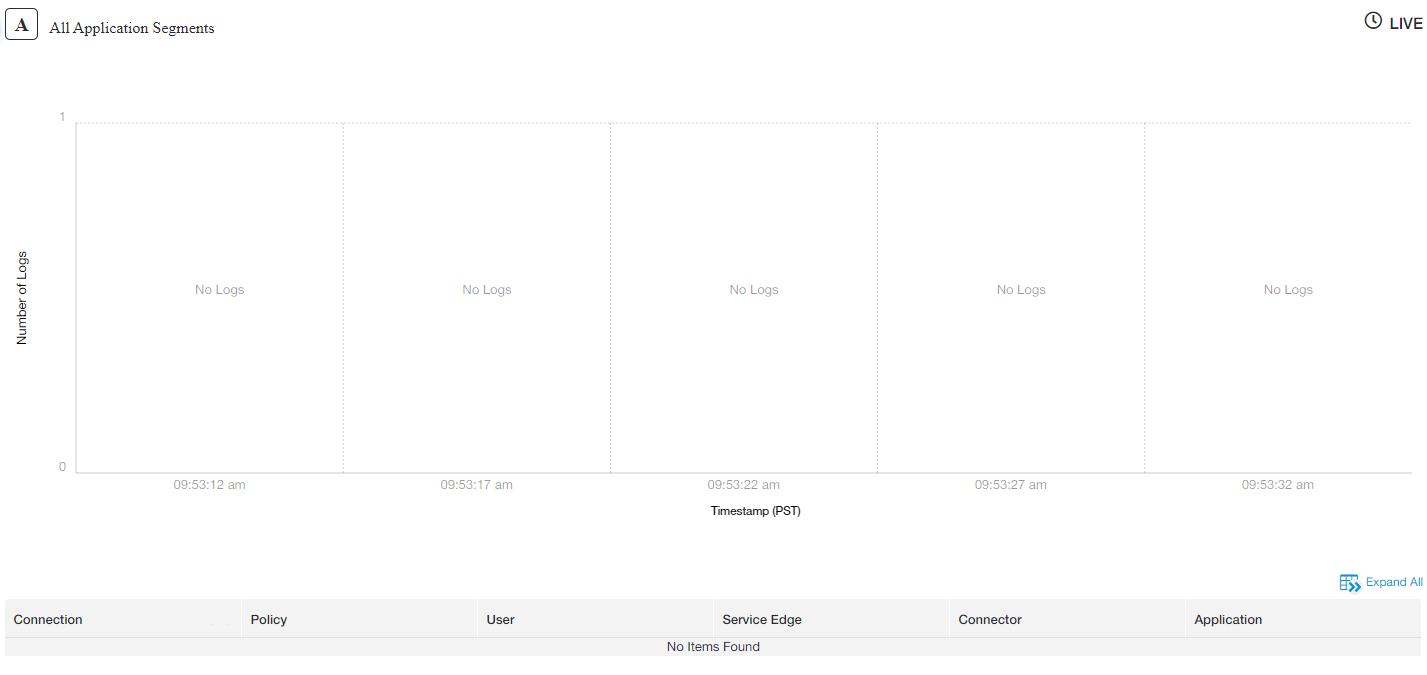
The chart streams the number of application logs as well as the time that the event took place.
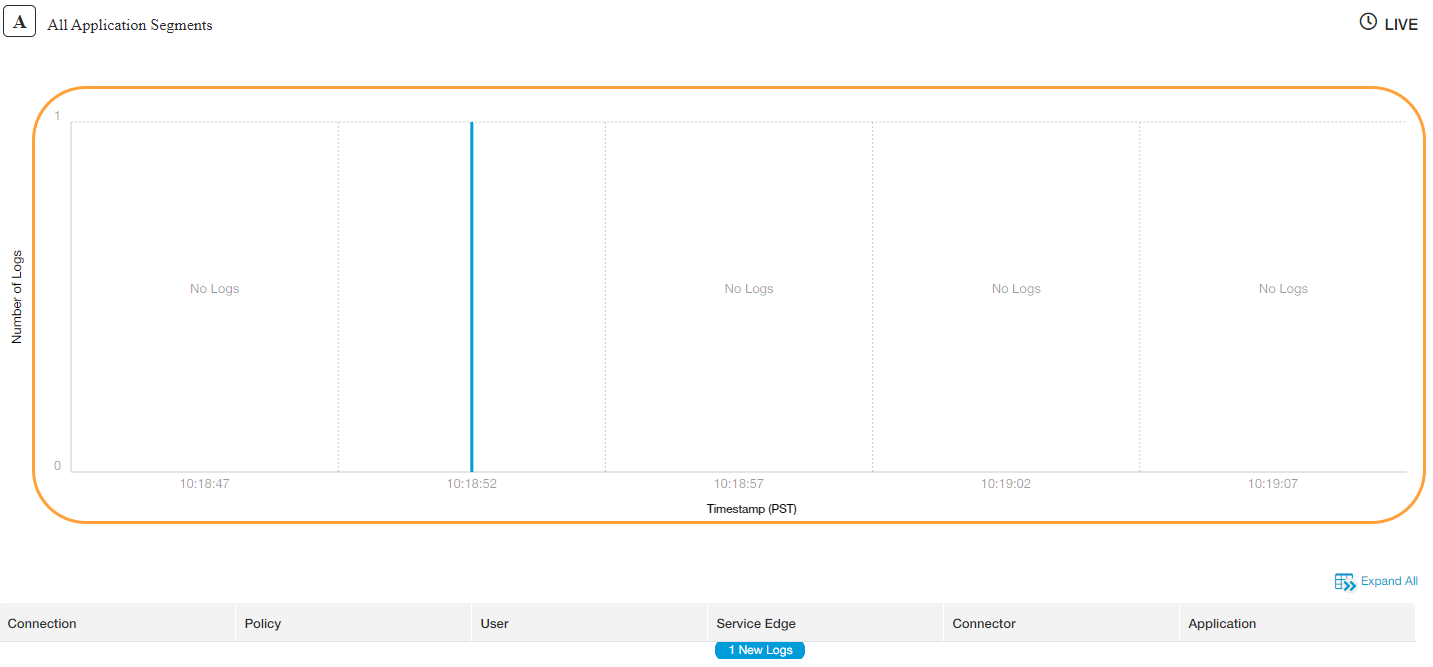
The chart tracks up to 100 of the latest application logs. It updates instantaneously when the Public Service Edges or Private Service Edges record new logs. By default, the table doesn't display any data. Click New Logs to populate the table. Every time you click New Logs the table refreshes, removing the older logs displayed with the newest.
Close
- View Application Activity Live Logs
The table displays the following data about application activity. You can expand each request to see even more data. The data within the Live Logs table is streamed in real time from the Public Service Edges or Private Service Edges.
- Connection
The Connection column sorts requests by the connection date and start time in descending order. The time displayed is based on the time you choose for your account setting in the Admin Portal.
- Start Time: The time the session started.
- End Time: The time the session ended.
- Status Code: The status of the application request. For errors and policy blocks, you can click the session status name to learn more about it. To see a complete list of session statuses, see Session Status Codes.
- Internal Status Code: The internal status reason. You can click the Copy icon to copy the internal reason to your clipboard. This field only applies to errors and policy blocks. To see a complete list of internal reasons per session status, see Session Status Codes.
- Status: Displays one of the following connection states:
- Open Connection
 : The user is currently connected to the application.
 - Active Connection
 : The user is currently using the application.
 - Closed Connection
 : The user's session has ended.
- Open Connection
- Duration: The duration of the connection to the application.
- Total Bytes: The total bytes (B) of the request and the response.
- Connection ID: The ID associated with the application request. You can click the Copy icon to copy the ID to your clipboard.
- Policy
- Access Policy Name: The access policy name as configured in the Admin Portal. You can click on the name to open the Edit Access Policy window.
- Timeout Policy Name: The timeout policy name as configured in the Admin Portal. You can click on the name to open the Edit Timeout Policy window.
- Action: Whether the access or timeout policy allowed or blocked the user from the application.
- Policy ID: The ID associated with the access or timeout policy. You can click the Copy icon to copy the ID to your clipboard.
- User
- Username: The user who requested the application. This is the NameID in the SAML assertion from the IdP and not the username entered in Zscaler Client Connector.
If you are using the Log Streaming Service (LSS), be aware that the Private Applications LSS Client user represents the LSS service, not an actual user. By default, Diagnostic information for the Private Applications LSS Client is captured but not displayed. You must explicitly select this user from the User field to display its log information. Also, each log receiver is displayed as an application, to reflect the data coming in from the service. To learn more, including how to stop the service from capturing Private Applications LSS Client logs, see Configuring a Log Receiver.
- IP: The IP address of the user's device.
- Location: The city and country the user is connecting from. If Private Applications are unable to determine the user's location, then the private IP is shown.
- Client Type: The name of the client the user's device is connecting from (i.e., Branch Connector, Zscaler Client Connector, Client Connector Partner, Web Browser, Web Browser Unauthenticated, or Internet & SaaS Public Service Edge).
- Service Edge
- Name: The name of the Public Service Edge or Private Service Edge used to connect the application to the user.
- Location: The location of the Public Service Edge or Private Service Edge used to connect the application to the user.
- Policy Processing: The latency in milliseconds (ms) between the Public Service Edge or Private Service Edge and the Central Authority (CA).
- App Connector
- Name: The name of the App Connector used to connect the application to the user. You can click on the name to open the Edit Connector window.
- IP:Port & Protocol: The IP address, port, and protocol of the App Connector.
- Location: The location of the App Connector used to connect the application to the user.
- App Connector ID: The internal ID for the connection request to the application. You can click the Copy icon to copy the ID to your clipboard.
- Connection Setup Time: The latency in milliseconds (ms) for the App Connector to setup the connection to the application server.
- App Connector Group Name: The name of the group the App Connector is included in. You can click on the name to open the Edit Connector Group window.
- App Connector Group ID: The internal ID for the App Connector group. You can click the Copy icon to copy the ID to your clipboard.
- Application
- Appplication: The fully qualified domain name (FQDN) or the IP address of the requested application.
- Name: The application segment name as configured in the Admin Portal. You can click on the name to open the Edit Application Segment window, which includes the defined application.
- Server IP:Port & Protocol: The IP address, port, and protocol of the server that hosts the application.
- Requested Port & Protocol: The destination port and protocol of the requested application.
- Application ID: The ID associated with the application. You can click the Copy icon to copy the ID to your clipboard.
- Server ID: The ID associated with the server. You can click the Copy icon to copy the ID to your clipboard.
- Double Encryption: Lists whether Double Encryption is enabled or disabled for the application.
- Connection
- Filter Application Activity Live Logs
For Live Log real-time events, you can use the default filters on the left panel and filter requests by:
- Application: See requests for a specific application. Enter the FQDN or IP address of the application.
- Session: See requests that resulted in a specific status.
Click Add Filters to add any of the following filters with the default ones:
- Protocol: See requests for connections using a specific protocol.
- Server Port: See requests for connections using a specific port.
- User: See requests from a particular username. This is the NameID in the SAML assertion from the IdP and not the username entered in Zscaler Client Connector.
If you are using the Log Streaming Service (LSS), be aware that the Private Applications LSS Client user represents the LSS service, not an actual user. By default, Diagnostic information for the Private Applications LSS Client is captured but not displayed. You must explicitly select this user from the User field to display its log information. Also, each log receiver is displayed as an application, to reflect the data coming in from the service. To learn more, including how to stop the LSS service from streaming Private Applications LSS Client logs, see Configuring a Log Receiver.
- Access Policy Name: See requests that triggered a specific access policy.
- Timeout Policy Name: See requests that triggered a specific timeout policy.
- User IP: See requests from a specific device IP address.
- Server IP: See requests with connections to applications hosted by a server at a specific IP address.
- Service Edge: Name (Public/Private): See requests with connections made by a specific Public Service Edge or Private Service Edge.
- Connection Status: See requests with Open, Active, or Closed connections.
- Client Type: See requests by the client type the user's device is connecting from (i.e., Branch Connector, Zscaler Client Connector, Client Connector Partner, Web Browser, Web Browser Unauthenticated, or Internet & SaaS Public Service Edge).
- Routed Through Service Edge: See requests that go through a Public Service Edge or Private Service Edge or not.
- Connection ID: See requests by the ID associated with the application request.
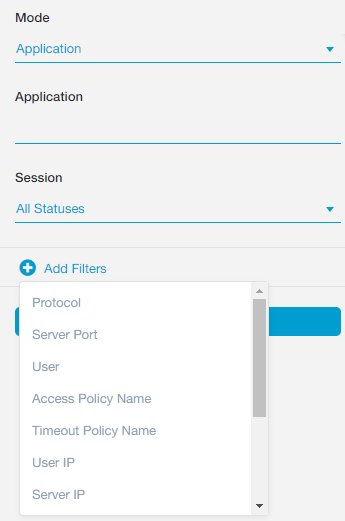
After you've chosen your filters, click Update to apply them.
Close
Viewing App Connector Status Real-Time Events and Logs
On the App Connector Status page (Logs > Insights > Live Logs and select Mode: App Connector Status), you can:
- View App Connector Status Real-Time Events
You can see live App Connector status activity within the chart. When App Connectors authenticate to the Zscaler cloud, the Public Service Edges or Private Service Edges record the data and send the App Connector logs to Private Applications.
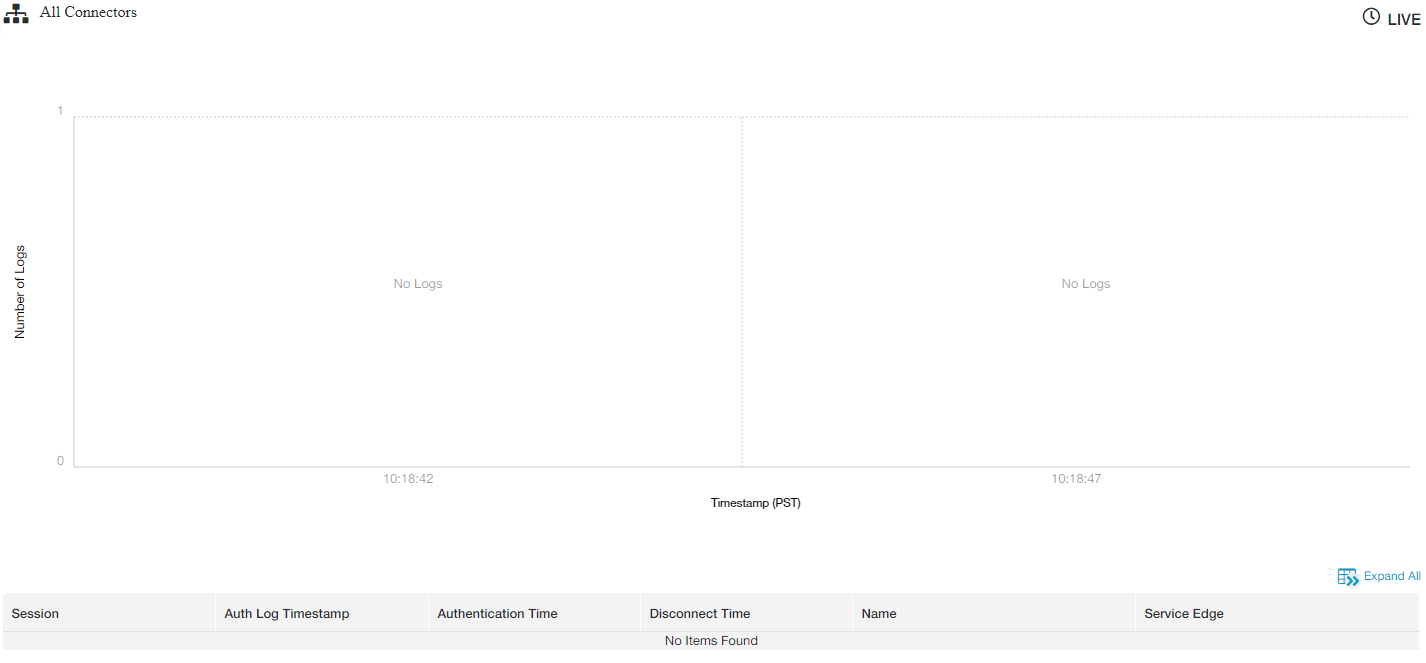
The chart streams the number of App Connector logs as well as the time that the event took place.
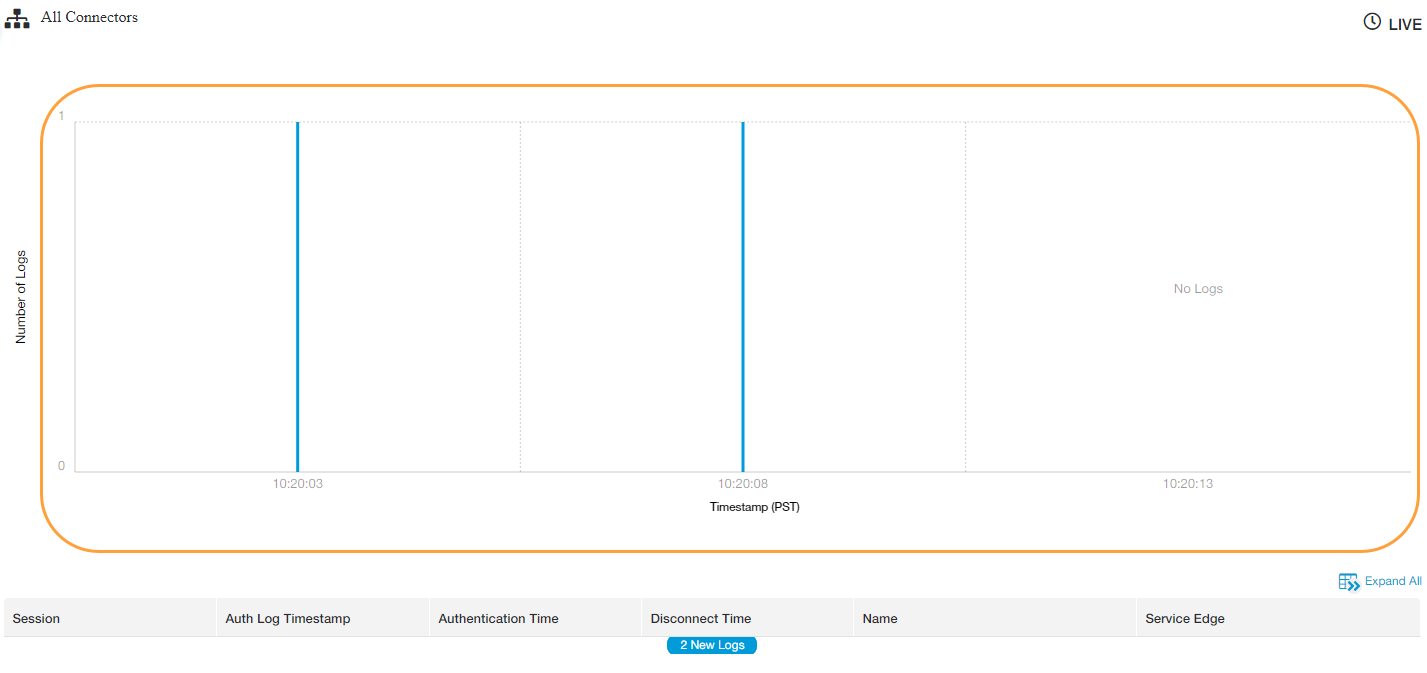
The chart tracks up to 100 of the latest App Connector logs. It updates instantaneously when the Public Service Edges or Private Service Edges record new logs. By default, the table doesn't display any data. Click New Logs to populate the table. Every time you lick New Logs the table refreshes, removing the older logs displayed with the newest.
Close
- View App Connector Status Live Logs
The table displays the following data about App Connector status. You can expand each request to see even more data. The data within the Live Logs table is streamed in real time from the Public Service Edges or Private Service Edges.
- Session
Displays one of the following session status codes:
- Authenticated: The App Connector successfully authenticated.
- Authentication Failed: The App Connector was unable to authenticate to the Zscaler cloud.
- Disconnected: The App Connector successfully disconnected.
For every session status code, the following fields are displayed:
- Connection Type: The type of connection the App Connector makes.
- Connection Status Log: View, download, and copy the raw JSON for the request:
- Click the View Log icon to display the Raw JSON for the request within the Admin Portal.
- Click the Download icon to download the raw JSON for the request to a text (.txt) file.
- Click the Copy icon to copy the raw JSON text for the request to your clipboard.
- Auth Log Timestamp
The data and time when the log was generated. The column sorts requests by the date and start time in descending order and in the time you choose for your account setting in the Admin Portal.
Close - Authentication Time
The time the App Connector authenticated to the Zscaler cloud. The column displays requests in the time you choose for your account setting in the Admin Portal and sorts requests based on the Auth Log Timestamp column date and time.
Close - Disconnect Time
The time that the App Connector disconnected from the Zscaler cloud. The column displays requests in the time you choose for your account setting in the Admin Portal and sorts requests based on the Auth Log Timestamp column date and time.
Close - Name
- App Connector Name: The name of the App Connector used to connect the application to the user. You can click on the name to open the Edit Connector window.
- App Connector ID: The internal ID for the connection request to the application. You can click the Copy icon to copy the ID to your clipboard.
- Public IP: The IP address used by the App Connector to connect to the Public Service Edge or Private Service Edge.
- Private IP: The internal IP address configured for the App Connector.
- Location: The city and country that the App Connector is connecting from.
- Service Edge
- Name: The name of the Public Service Edge or Private Service Edge used to connect the application to the user.
- Location: The location of Public Service Edge or Private Service Edge used to connect the application to the user.
- Session
- Filter App Connector Status Live Logs
For Live Log real-time events, you can use the default filters on the left panel and filter requests by:
- App Connector Name: See events for a specific App Connector you've configured.
- Session: See events that resulted in a specific status.
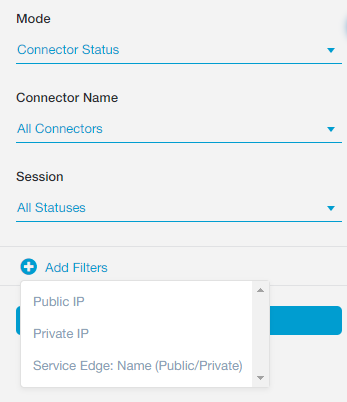
Click Add Filters to add any of the following filters with the default ones:
- Public IP: See events for a public App Connector IP address, which is used to reach out to the Public Service Edge or Private Service Edge.
- Private IP: See events for a private App Connector IP address, which is the internal IP address configured for the App Connector.
- Service Edge: Name (Public/Private): See events with connections made by a specific Public Service Edge or Private Service Edge.
After you've chosen your filters, click Update to apply them.
Close
Viewing Private Service Edge Status Real-Time Events and Logs
On the Private Service Edge Status page (Logs > Insights > Live Logs and select Mode: Private Service Edge Status), you can:
- View Private Service Edge Status Real-Time Events
You can see live Private Service Edge status activity within the chart. When Private Service Edges connect users to App Connectors, a record of the event and the Private Service Edge logs are sent to Private Applications.
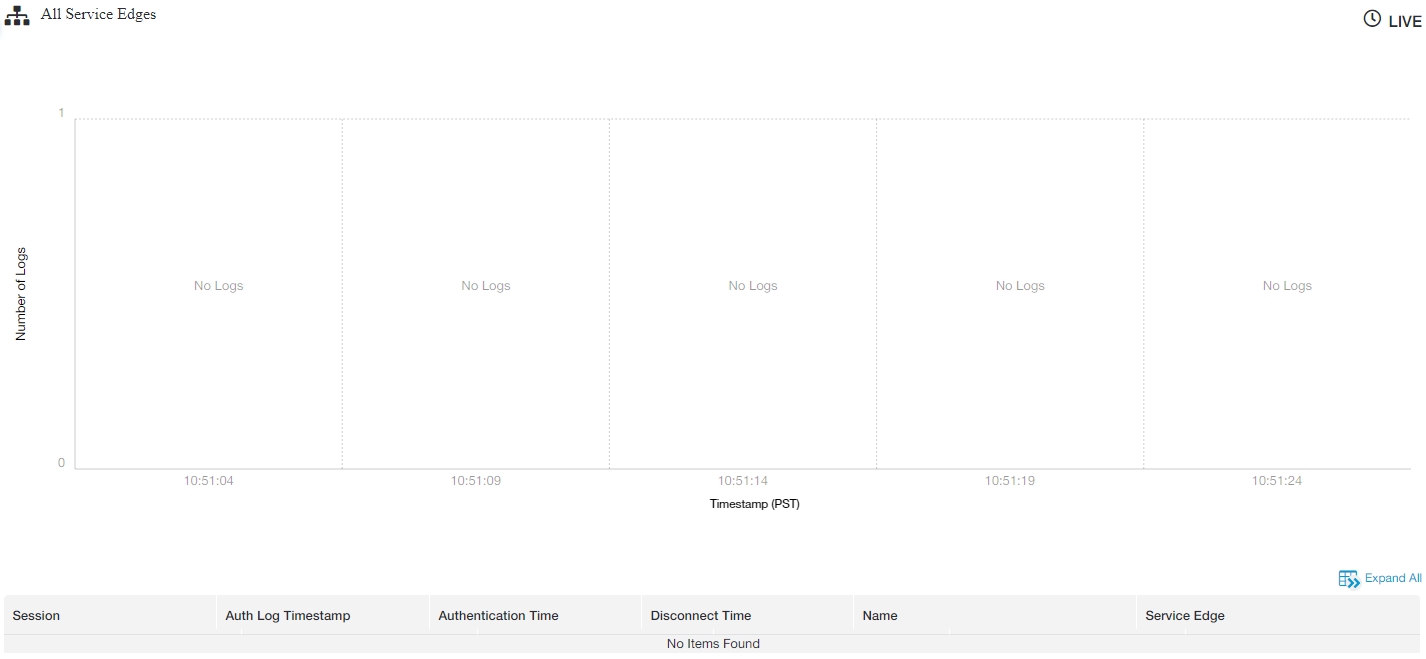
The chart streams the number of Private Service Edge logs as well as the time that the event took place.
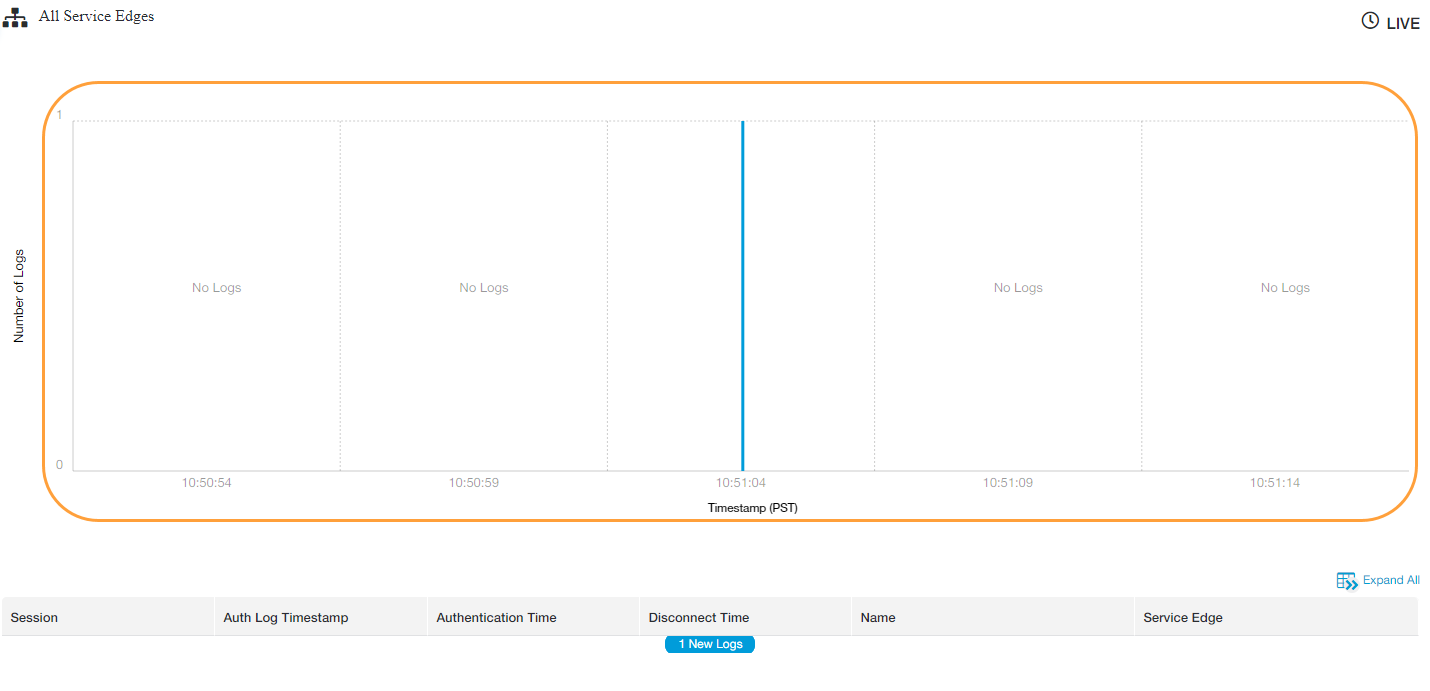
The chart tracks up to 100 of the latest Private Service Edge logs. It updates instantaneously when the Cloud records new logs. By default, the table doesn't display any data. Click New Logs in the table to populate it. Every time you click New Logs the table refreshes, removing the older logs displayed with the newest.
Close
- View Private Service Edge Status Live Logs
The table displays the following data about Private Service Edge status. You can expand each request to see even more data. The data within the Live Logs table is streamed in real time from the Private Service Edges.
- Session
Displays one of the following session status codes:
- Authenticated: The Private Service Edge successfully authenticated.
- Authentication Failed: The Private Service Edge was unable to authenticate to the Zscaler cloud.
- Disconnected: The Private Service Edge successfully disconnected.
For every session status code, the following fields are displayed:
- Connection Type: The type of connection the Private Service Edge makes.
- Connection Status Log: View, download, and copy the raw JSON for the request:
- Click the View Log icon to display the Raw JSON for the request within the Admin Portal.
- Click the Download icon to download the raw JSON for the request to a text (.txt) file.
- Click the Copy icon to copy the raw JSON text for the request to your clipboard.
- Auth Log Timestamp
The data and time when the log was generated. The column sorts requests by the date and start time in descending order and in the time you choose for your account setting in the Admin Portal.
Close - Authentication Time
The date and time the Private Service Edge authenticated to the Zscaler cloud. The column displays requests in the time you choose for your account setting in the Admin Portal and sorts requests based on the Auth Log Timestamp column date and time.
Close - Disconnection Time
The date and time the Private Service Edge disconnected from the Zscaler cloud. The column displays requests in the time you choose for your account setting in the Admin Portal and sorts requests based on the Auth Log Timestamp column date and time.
Close - Name
- Service Edge Name: The name of the Private Service Edge that processed the connection between the user to the App Connector. You can click on the name to open the Edit Service Edge window.
- Service Edge ID: The internal ID for the connection from the user to App Connector. You can click the Copy icon to copy the ID to your clipboard.
- Public IP: The IP address used by the Private Service Edge to connect to Private Applications.
- Private IP: The internal IP address configured for the Private Service Edge.
- Location: The city and country that the Private Service Edge is connecting from.
- Service Edge
- Name: The name of the Public Service Edge.
- Location: The city or country where the Public Service Edge is located.
- Session
- Filter Private Service Edge Status Live Logs
For Live Log real-time events, you can use the default filters on the left panel and filter requests by selecting:
- Private Service Edge: Name: See events for a specific Private Service Edge you've configured.
- Session: See events that resulted in a specific status.
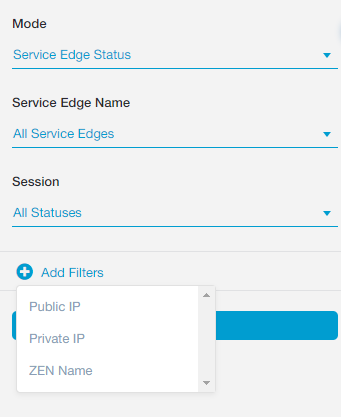
Click Add Filters to add any of the following filters with the default ones:
- Public IP: See events for a Private Service Edge's public IP address, which is used to reach out to Private Applications.
- Private IP: See events for a Private Service Edge's private IP address, which is the internal IP address configured for the Private Service Edge.
- Service Edge Name: See events for the Public Service Edge or Private Service Edge that processed the connection.
After you've chosen your filters, click Update to apply them.
Close
