Experience Center
Accessing Clientless Access Diagnostics
You can view and filter Clientless Access data for past browser session events.
To view diagnostics for clientless access:
- Go to Logs > Insights > Diagnostics.
- Under Log Type, choose Clientless Access.
By default, the detailed activity for all clientless access is displayed for events that occurred in the last 24 hours. To change the time range, click the Calendar menu and select a preset range or specify a custom start and end date. If you use a Custom Range, the start date must be within the last 14 days. To change the time zone, click the current Time Zone button.
Zscaler retains logs for rolling periods of at least 14 days during your subscription term. You can also view your logs or stream logs in real time using the Log Streaming Service (LSS). Data in the dashboard might be more recent than the data presented within Diagnostics for the same time range.

Viewing Logs
Log activity is automatically displayed after selecting the Clientless Access log type.
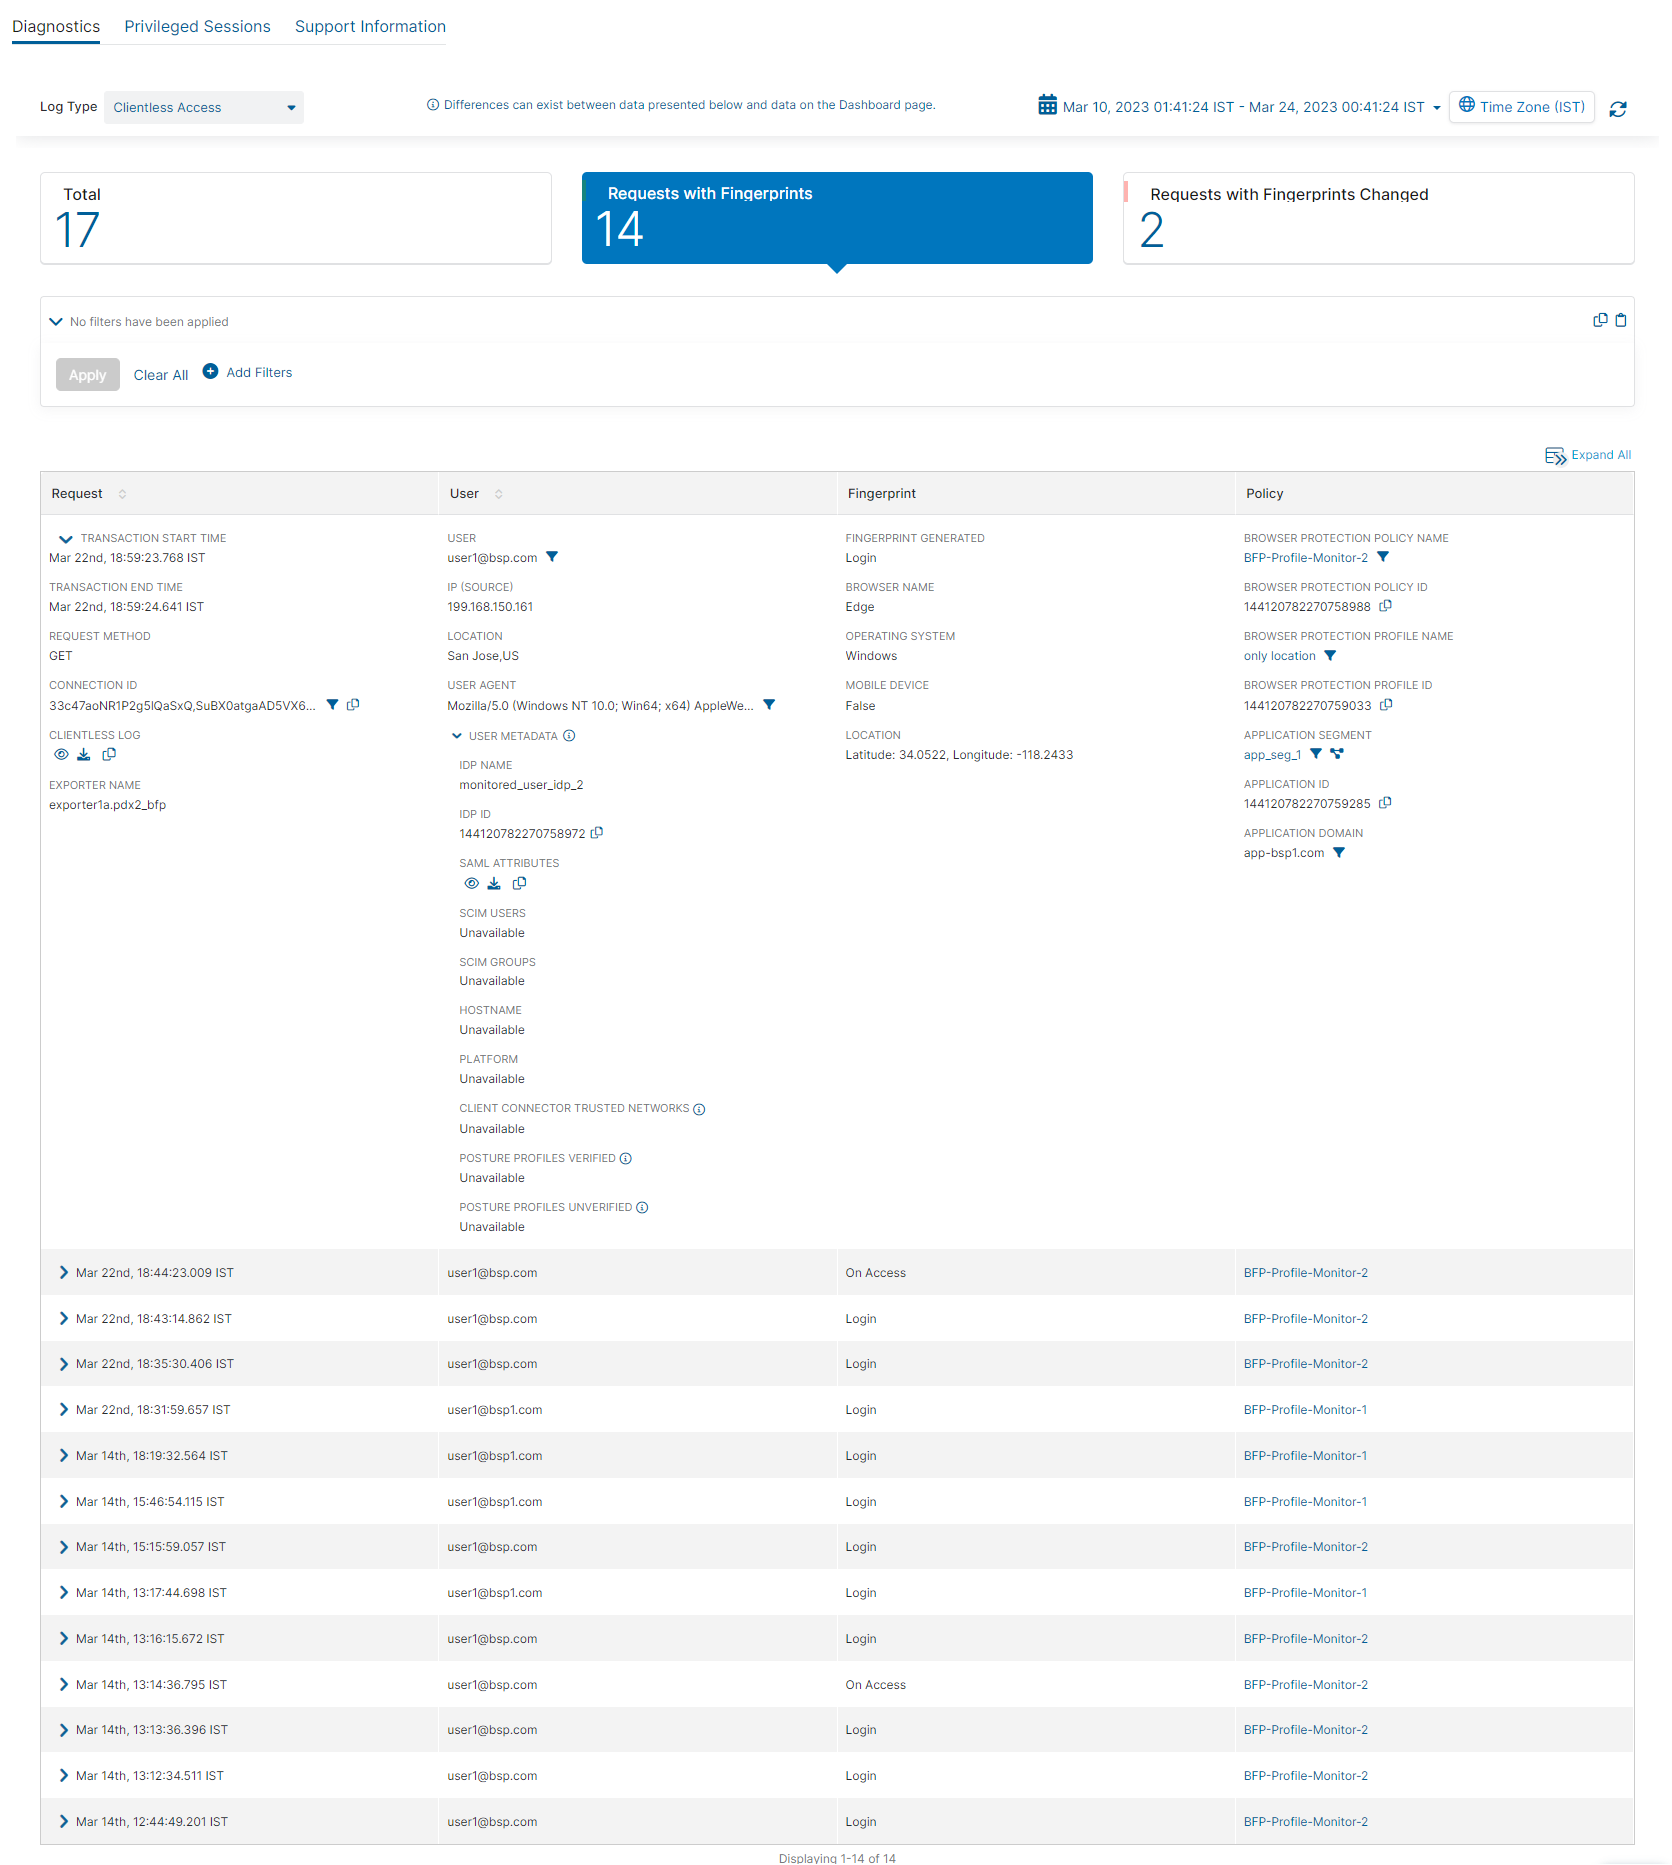
By default, the table displays the Total number of clientless access requests made by monitored users. You can change this by choosing one of the following filters:
- Requests with Fingerprints: The total number of clientless access requests with fingerprints.
- Requests with Fingerprints Changed: The total number of clientless access requests with fingerprints that have changed over the specified time range.

Filtering Clientless Access Logs
On the Clientless Access page, you can apply filters or drill down further into the log data using the Query Builder. By default, no filters are applied.
To configure filters using the Query Builder:
- Click Add Filters and select a filter from the drop-down menu:
- Application: Domain: See requests for a specific application. Enter the FQDN or IP address of the application.
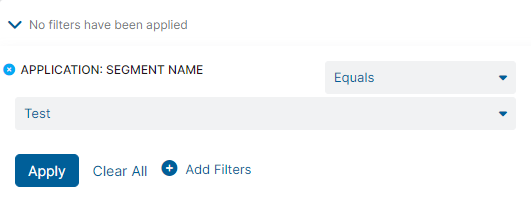
- Application: Segment Name: See requests by application segment name as configured in the Admin Portal.
- Browser: See requests for a specific browser. Enter the browser name.
- Browser Fingerprint: Changed After Login: See requests for a specific browser fingerprint that was changed after the monitored user logged in.
- Browser Fingerprint: On Login: See requests for a specific browser fingerprint that was changed when the user logged in.
- Browser Fingerprint: Present: See requests for a specific browser fingerprint that are currently present.
- Browser Protection Policy: Name: See requests that triggered a specific browser protection policy.
- Browser Protection Profile: Name: See requests for a specific browser protection profile name. Enter the browser protection profile name.
- Connection: Connection ID: See requests by the connection ID.
- Domain ID: See requests by the domain ID.
- Operating System: See requests by the operating system.
- Session ID: See requests by one-user login sessions. This filter shows all fingerprints captured for a given session. All fingerprints should be the same for all domains accessed by the user in the same session. If there is a change, it means attributes for the fingerprint have changed for the user (i.e., location, screen resolution, etc.).
- User Agent: See requests by the profile of the user machine, operating system version, and web browser.
- User Email: See requests by the email address of the monitored user.
- Select an operator from the drop-down menu (e.g., Contains, Ends With, Equals, Not Equals, Starts With). The operators available are determined by the filter you are configuring.
- Select the fields from the drop-down menu or enter the values required for the filter. The field or value required is determined by the filter you are configuring.
Filters using the Contains operator allow a maximum of 7 entries. All filters using operators that require text input must use a semicolon (;) to separate multiple entries (e.g., 137; 138; 139). When configuring multiple text entries and using the Less Than operator, the results show transactions starting from the largest entry provided. When configuring multiple text entries and using the Greater Than operator, the results show transactions starting from the smallest entry provided.
- Click Apply.

To apply more filters, click Add Filters again or click on the Apply Filter icon (![]() ) within the table. The filter query section within the page updates automatically to include the proper filter for the field name you selected, along with the applicable operator configuration for that field.
) within the table. The filter query section within the page updates automatically to include the proper filter for the field name you selected, along with the applicable operator configuration for that field.
To remove an added filter, click the Close icon then Apply. To remove all filters, click Clear All.
You can also click the Copy icon to save the filter query details. If you or another admin access Diagnostics, you can paste the query into the field by clicking the Clipboard icon.
![]()
The table displays the following data for Browser Protection requests:
- Request
The Request column sorts Browser Protection requests by the connection date and start time in descending order.
- Transaction Start Time: The date and time the transaction started.
- Transaction End Time: The date and time the transaction ended.
- Request Method: The method in which the browser request was made.
- Connection ID: The ID associated with the browser request. Click the Copy icon to copy the ID to your clipboard.
- Clientless Log: View, download, and copy the raw JSON for the request:
- Click the View Log icon to display the Raw JSON for the request within the Admin Portal.
- Click the Download icon to download the raw JSON for the request to a text (.txt) file.
- Click the Copy icon to copy the raw JSON text for the request to your clipboard.
- Exporter Name: The name of the exporter used for the request.
- User
- User: The email address of the user who requested the browser.
- IP (Source): The IP address of the user's device.
- Location: The city and country the user is connecting from. If Private Applications is unable to determine the user's location, then the private IP address is shown.
- User Agent: The profile of the user machine, operating system version, and web browser that initiated the transaction.
- User Metadata: The metadata of the user who requested the browser:
- IDP Name: The name of the IdP as configured in the Admin Portal.
- IDP ID: The ID associated with the IdP. Click the Copy icon to copy the ID to your clipboard.
- SAML Attributes: View, download, and copy the SAML attributes for the user:
- Click the View Log icon to display the SAML Attributes for the user within the Admin Portal.
- Click the Download icon to download the SAML attributes statement for the user to a text (.txt) file.
- Click the Copy icon to copy the SAML attribute statement for the user to your clipboard.
- SCIM Users: The name of the user as identified by the IdP.
- SCIM Groups: The name of the group as identified by the IdP.
- Hostname: The hostname of the user's device.
- Platform: The platform on the user's device.
- Client Connector Trusted Networks: The names of the trusted networks accessible by the user's device.
- Posture Profiles Verified: If Zscaler Client Connector verified the user's device against the criteria specified in the posture profile, then TBD is displayed for this field.
- Fingerprint
- Fingerprint Generated: How the fingerprint was generated.
- Browser Name: The name of the browser that the user accessed for the request.
- Operating System: The operating system that was used for the request.
- Mobile Device: If a mobile device was used for the request, it shows as True. If a mobile device was not used for the request it shows as False.
- Location: The latitude and longitude of the fingerprint's location.
- JA3: The JA3 fingerprint. This field only shows if you selected the JA3 hash when configuring Browser Protection Profiles.
You might see different results based on the machine and browser you are using.
Close - Policy
- Browser Protection Policy Name: The name of the Browser Protection policy configured. Click the name to edit the AppProtection policy.
- Browser Protection Policy ID: The ID of the Browser Protection policy configured. Click the Copy icon to copy the ID to your clipboard.
- Browser Protection Profile Name: The name of the Browser Protection profile. Click the name to edit the Browser Protection profile.
- Browser Protection Profile ID: The ID of the Browser Protection profile. Click the Copy icon to copy this ID to your clipboard.
- Application Segment: The application segment name as configured in the Admin Portal. Click on the name to open the Edit Application Segment window, which includes the defined application.
- Application ID: The ID associated with the application. Click the Copy icon to copy the ID to your clipboard.
- Application Domain: The domain of the application in the transaction request.
- User Portal: The name, ID, and domain of the application segment. Click the Copy icon to copy the ID to your clipboard. When you select User Portal criteria, this field replaces the Application Segment, Application ID, and Application Domain fields.
You can expand each row to see more details or click the Expand/Collapse icon to expand or collapse all rows within the table. By default, the table displays 20 transactions. You can scroll to load more transactions.
