Experience Center
Viewing the Browser Protection Dashboard
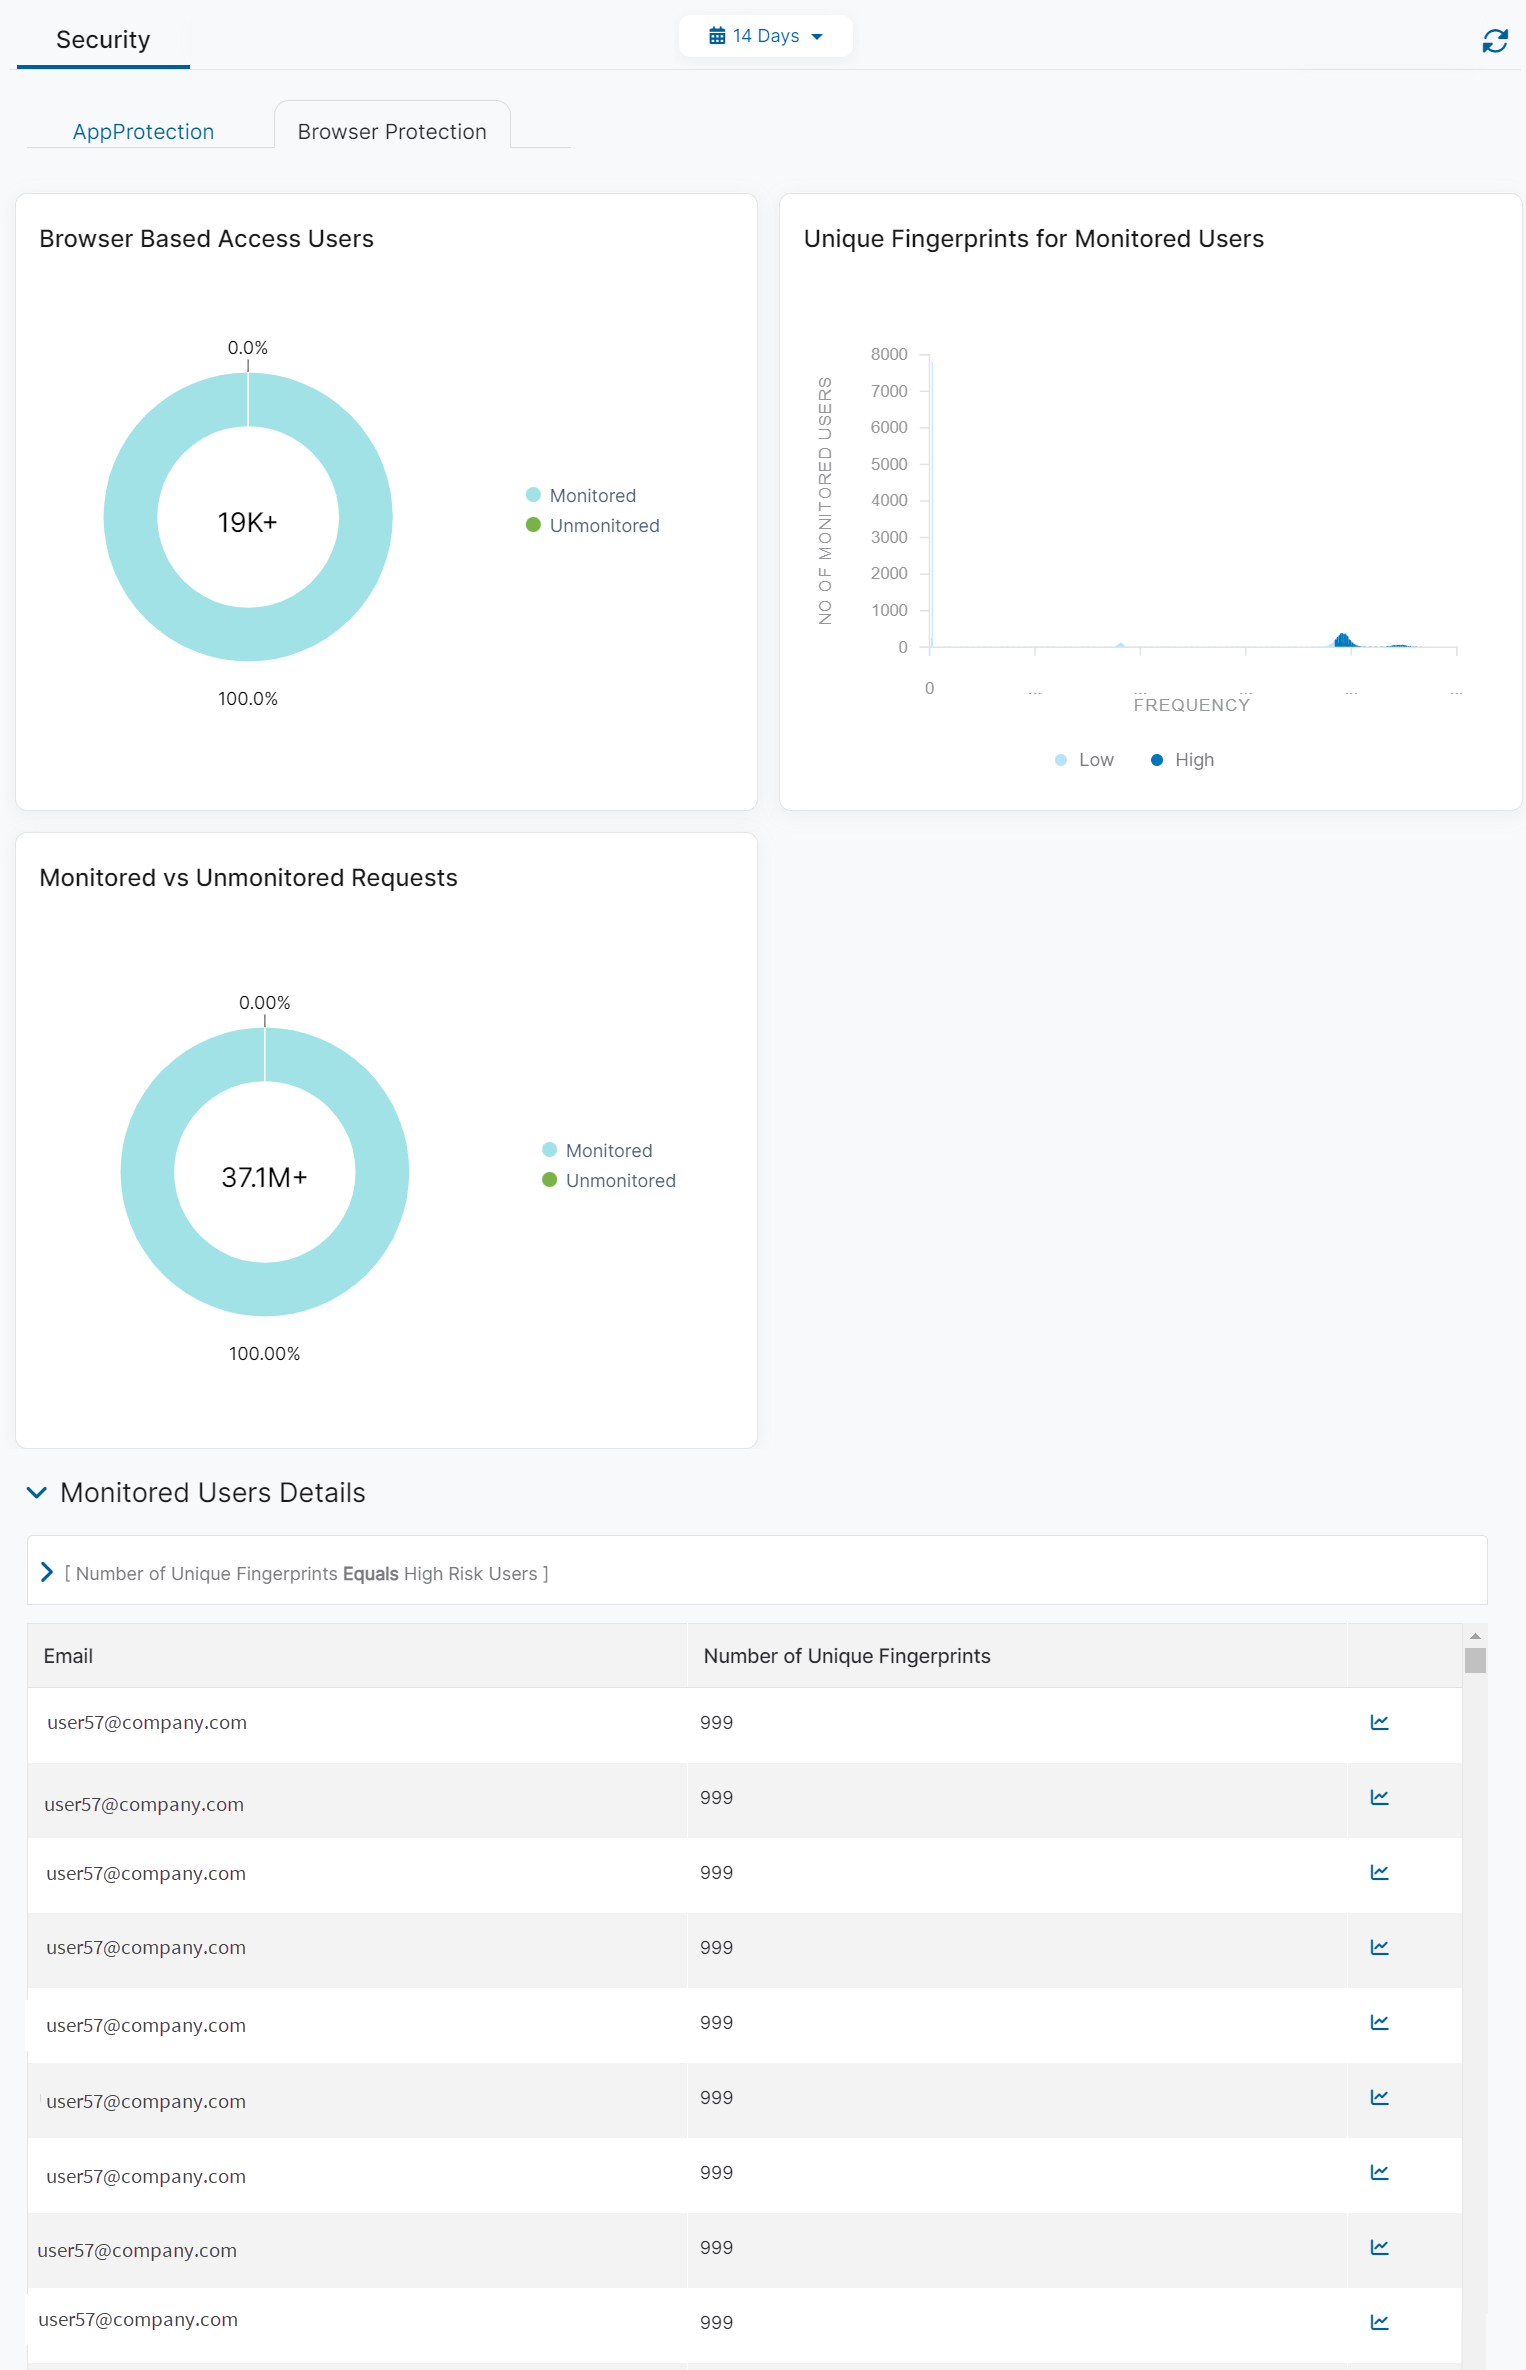
The Browser Protection dashboard (Analytics > Private Applications > Security > Browser Protection) provides information about browser sessions in your organization.
Dashboard Tools
The Browser Protection dashboard displays the following information and functionality:
- Time Range Filter: View Browser Protection data over a period between 1 Hour to 14 Days, or you can select Custom Range. If you use a Custom Range, the start date must be within the last 14 days. The end date automatically sets to the system's current time. By default, the dashboard displays information for events that occurred in the last hour. This filter applies to all widgets on the dashboard.
Log information in the dashboard is limited to 14 days. For longer access to the logs, use the Log Streaming Service (LSS).
- Refresh Icon: Refresh the dashboard to reflect the most current information.
- Go to the AppProtection page to view the AppProtection dashboard information.
Widgets
The Browser Protection dashboard provides the following widgets:
- Browser Based Access Users
The widget displays real-time users that are affiliated with browser-based access. The categories are Monitored and Unmonitored, representing the monitored and unmonitored users and shows them based on their percentages within the selected time frame.
Close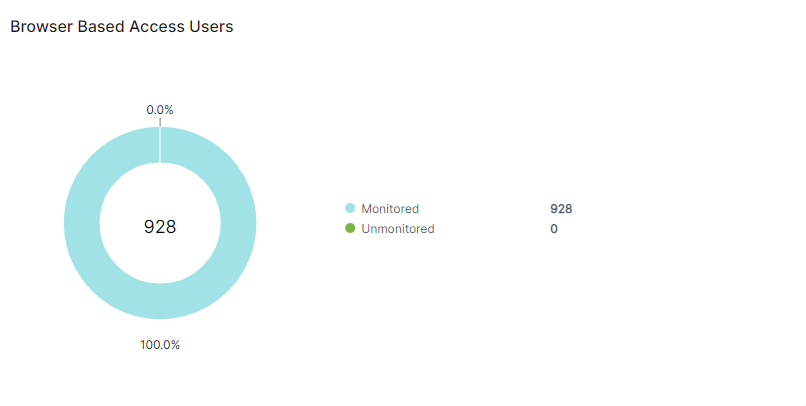
- Unique Fingerprints for Monitored Users
The widget displays the browser sessions that have the fingerprint option enabled for monitored users. The unique fingerprints for monitored users are grouped by low and high frequency percentages within the selected time frame by the number of monitored users. If frequent changes exist on a fingerprint, there is a high possibility of malicious activity. This widget allows you to keep a closer eye on monitored users' activity.
Close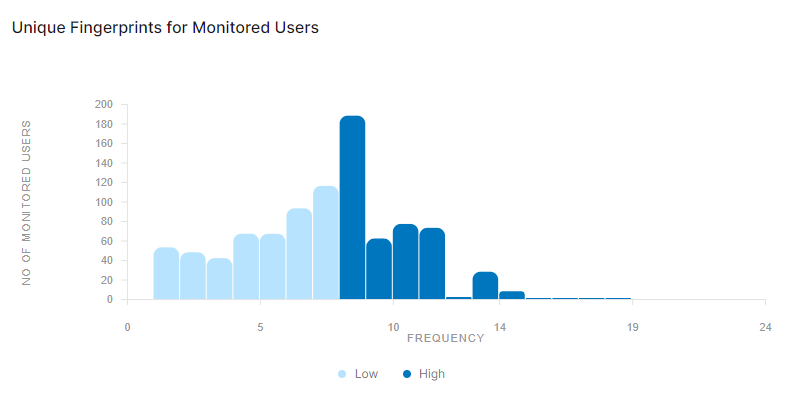
- Monitored vs. Unmonitored Requests
The widget displays the amount of browser session requests from monitored and unmonitored users. The categories are Monitored and Unmonitored, representing the monitored and unmonitored users and shows them based on their percentages within the selected time frame.
Close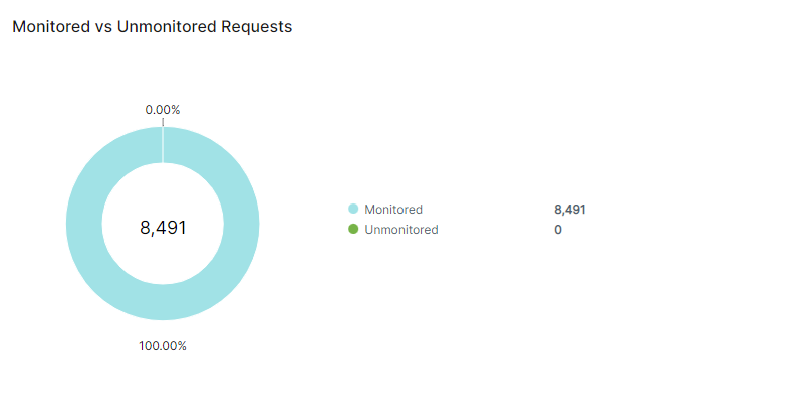
- Monitored Users Details
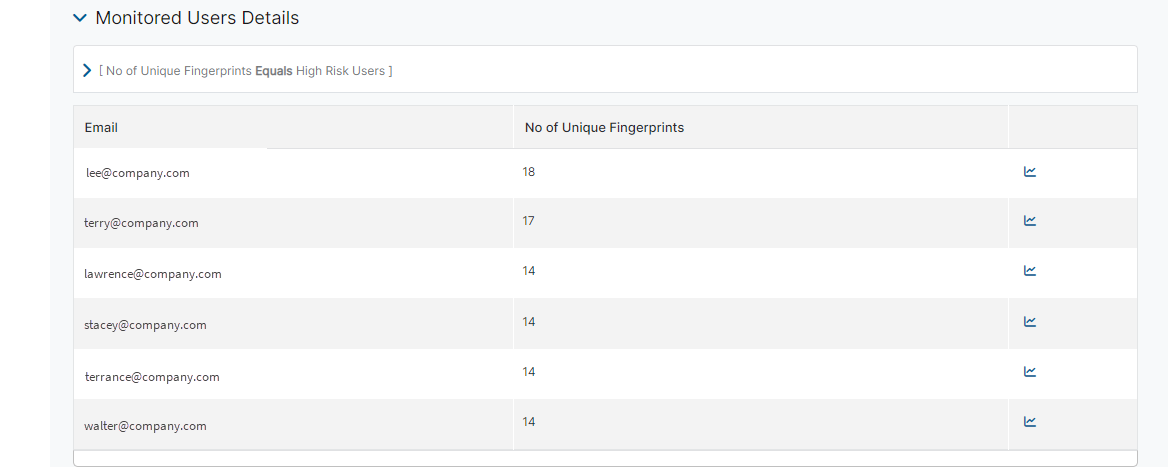
The Monitored Users Details table provides information on monitored users within the specified time frame. You can filter the information that appears in the table. By default, no filters are applied.
The table covers:
- Email: The email address of the monitored user.
- Number of Unique Fingerprints: The number of browser sessions with Fingerprint enabled that the monitored user has accessed.
- Actions: Click the Diagnostics icon
 to go to the Clientless Access Diagnostics page.
Close