Experience Center
Viewing the AppProtection Dashboard
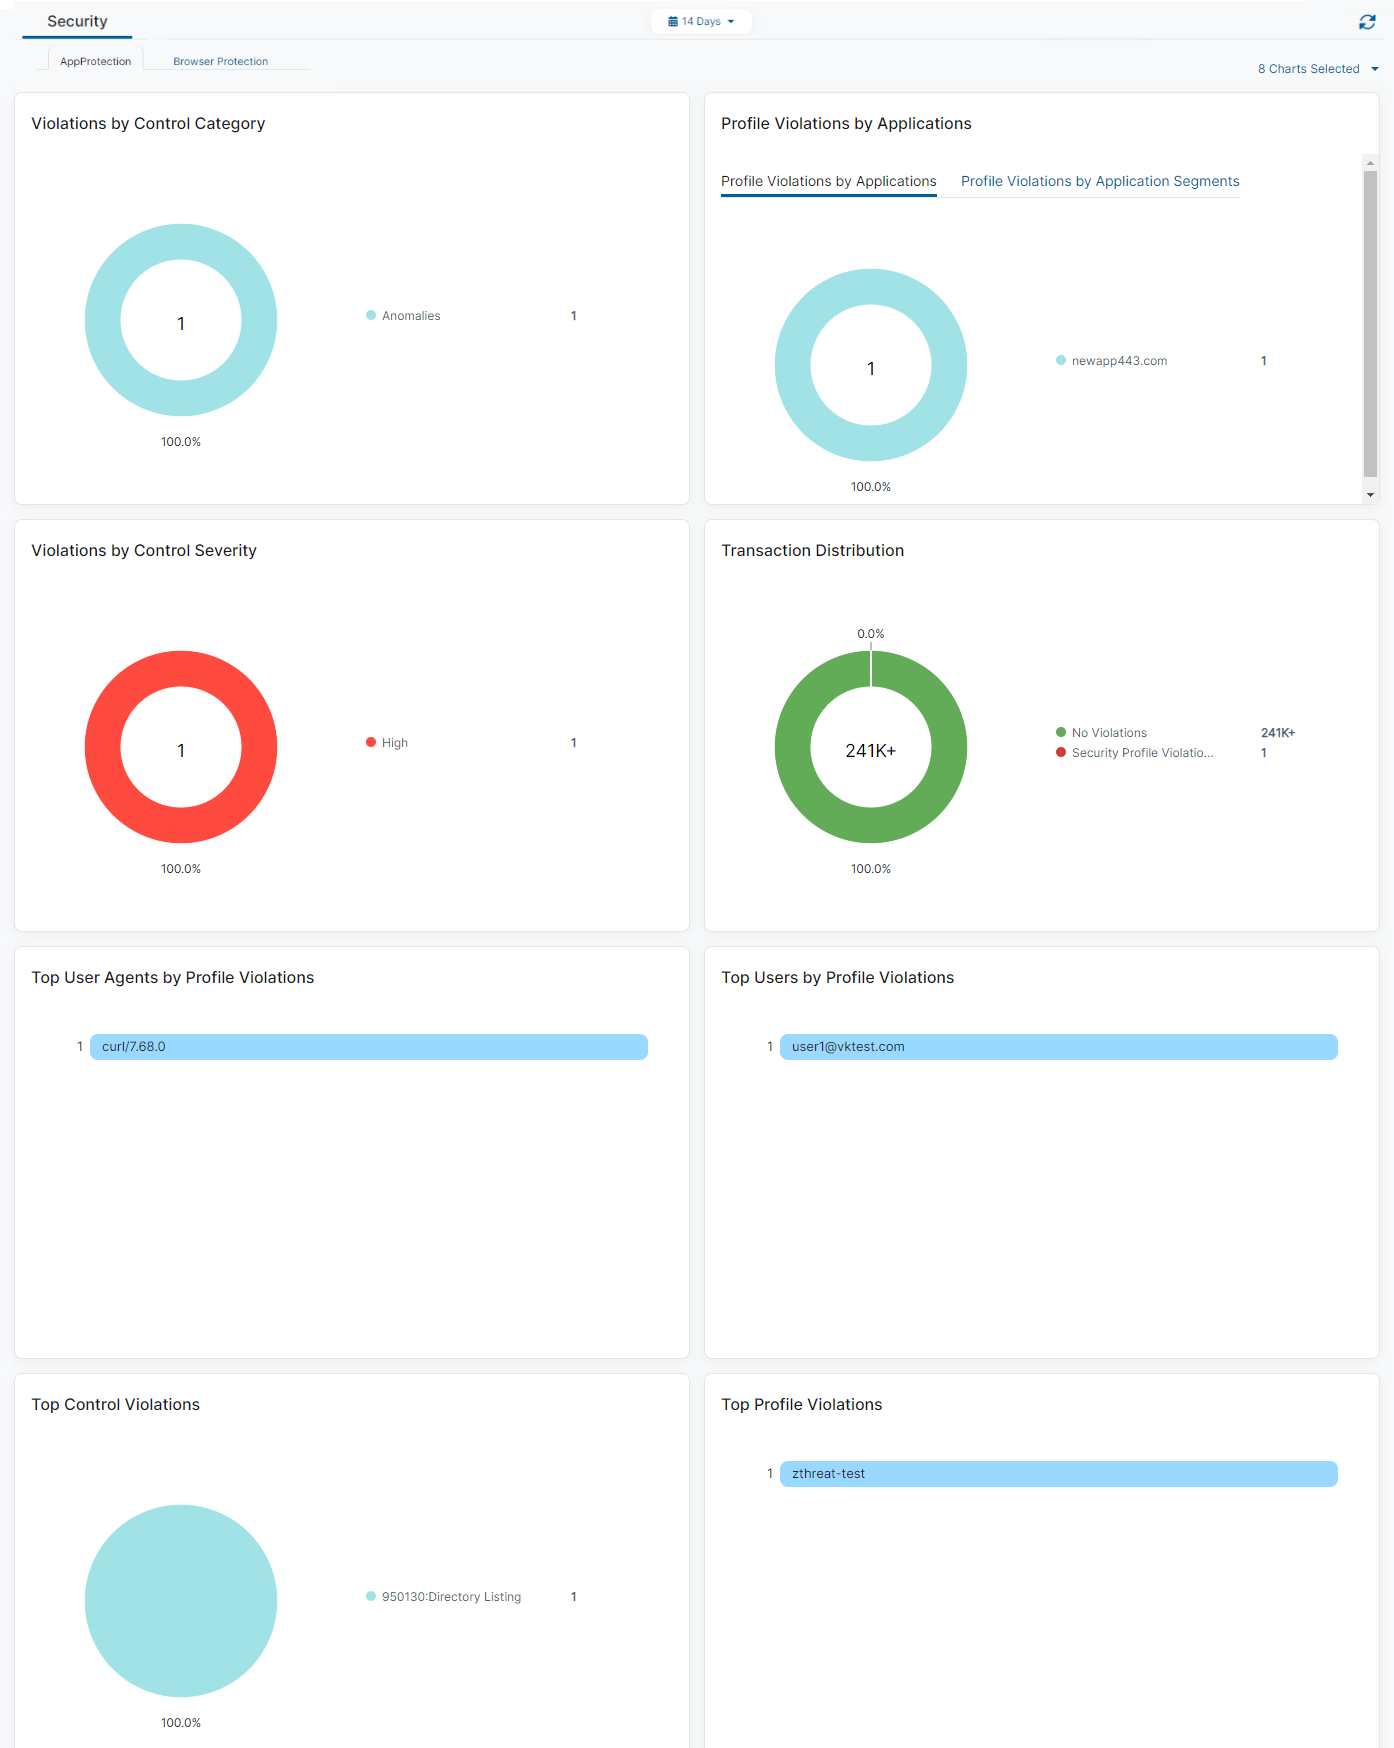
The AppProtection dashboard (Analytics > Private Applications > Security > AppProtection) provides information about the AppProtection policy activity in your organization.
Dashboard Tools
The AppProtection dashboard displays the following information and functionality:
- Time Range Filter: View AppProtection data over a period between 1 Hour to 14 Days, or you can select Custom Range. If you use a Custom Range, the start date must be within the last 14 days. The end date automatically sets to the system's current time. By default, the dashboard displays information for events that occurred in the last hour. This filter applies to all widgets on the dashboard.
Log information in the dashboard is limited to 14 days. For longer access to the logs, use the Log Streaming Service (LSS).
- Refresh Icon: Refresh the dashboard to reflect the most current information.
- Browser Protection Dashboard: View the Browser Protection Dashboard for information about browser sessions in your organization.
- Chart Selection Filter: Click the Chart Selection drop-down menu for a list of charts that displays AppProtection policy data. Select desired charts on the list to customize which charts are displayed or hidden on the dashboard.
Widgets
The AppProtection dashboard provides the following widgets:
- Violations by Control Category
The widget displays security violations within the selected time frame and categorizes them by the ThreatLabZ, WebSocket, and OWASP predefined top 10 control categories. The control categories are based on the ThreatLabZ Predefined Controls, WebSocket Predefined Controls, OWASP Predefined Controls, WebSocket Custom Controls, and HTTP Custom Controls, and are found in AppProtection Controls (Policies > Cybersecurity > Inline Security > Protection Controls).
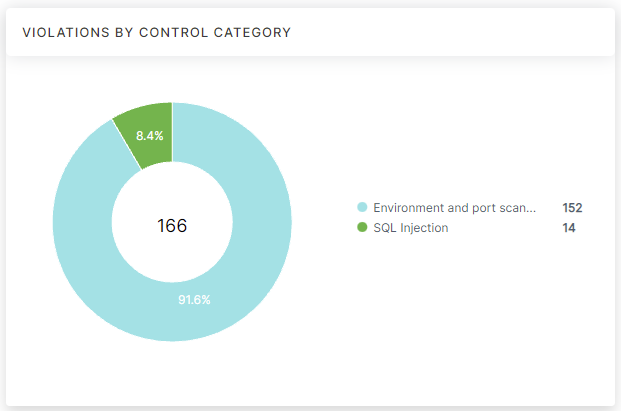
- Hover over a section of the chart to view its control category.
- Click on a section of the chart and then click View Logs to be directed to log information matching the control category in Web AppProtection Diagnostics.
- Profile Violations by Application
The widget displays profile violations within the selected time frame and categorizes them by application.
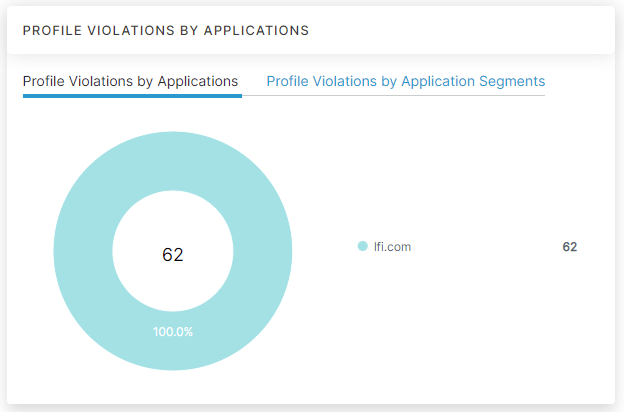
- Click on the upper navigation tabs to switch between a chart of profile violations by applications or application segments.
- Hover over a section of the chart to view the name of the application or application segment.
- Click on a section of the chart and then click View Logs to be directed to log information matching that application or application segment in Web AppProtection Diagnostics.
- Violations by Control Severity
The widget displays security violations within the selected time frame and categorizes them by severity rating (i.e., Critical, High, Medium, Low).
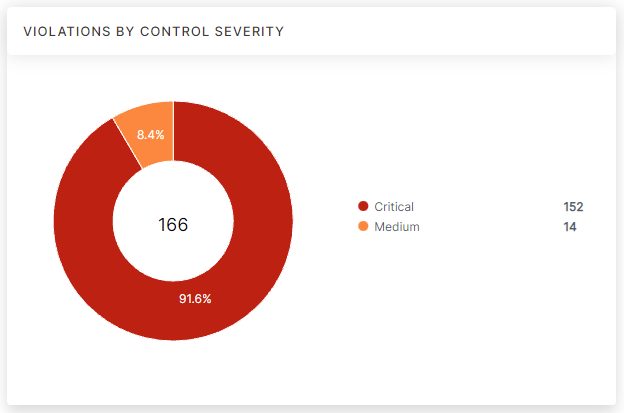
- Hover over a section of the chart to view the severity rating.
- Click on a section of the chart and then click View Logs to be directed to log information matching that severity rating in Web AppProtection Diagnostics.
- Transaction Distribution
The widget displays the transaction distribution of traffic with no violations and traffic with violations across an organization within the selected time frame.
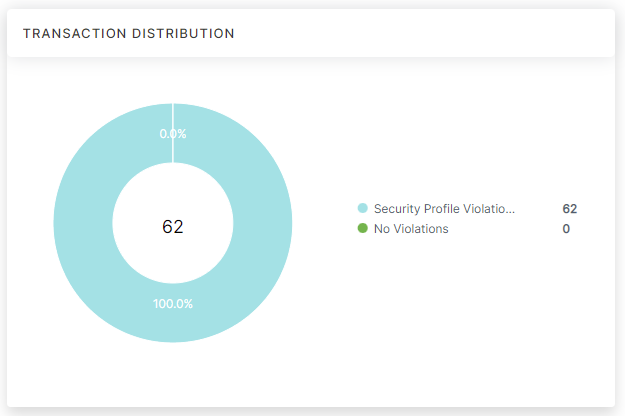
- Hover over a section of the chart to view the violation type by No Violations or by Security Profile Violations.
- Click on a section of the chart and then click View Logs to be directed to log information matching that violation status in Web AppProtection Diagnostics.
- Top User Agents with Profile Violations
The widget displays the top 10 profile violations within the selected time frame and lists them by user agent.
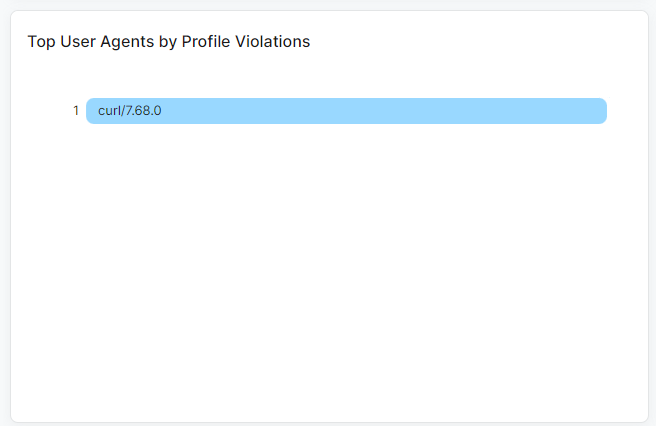
- Hover over a user agent to view the following:
- Name: The details about the user agent such as browser, machine, and software version.
- Number of Top User Agents by Profile Violation(s): The number of profile violations for the selected user agent and the percentage of violations held by that user agent within the top users category.
- Click on a user agent and then click View Logs to be directed to log information matching that user agent in Web AppProtection Diagnostics.
- Hover over a user agent to view the following:
- Top Users with Profile Violations
The widget displays the top 10 profile violations within the selected time frame and lists them by user.
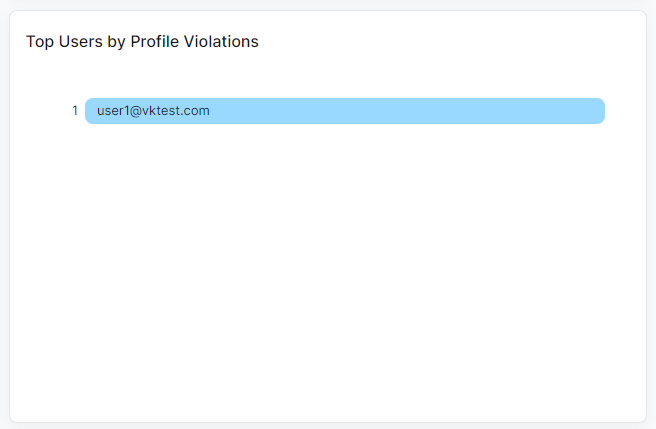
- Hover over a user to view the following:
- Name: The name of the user.
- Number of Top Users by Profile Violation(s): The top users with their number of profile violations and the percentage of violations held by that user within the top users category.
- Click on a user and then click View Logs to be directed to log information matching that user in AppProtection Diagnostics.
- Hover over a user to view the following:
- Top Control Violations
This widget displays the top 10 control violations within the selected time frame and categorizes them by name. The top control violations are categorized by control number and name, in the ControlNumber:ControlName format.
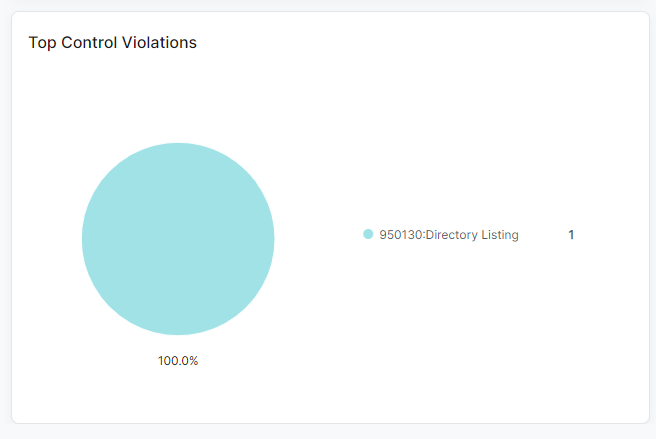
- Hover over a section of the chart to view the name of the control violation.
- Click on a section of the chart and then click View Logs to be directed to log information matching that control violation in Web AppProtection Diagnostics.
- Top Profile Violations
The widget displays the top 10 profile violations within the selected time frame and lists them by name.
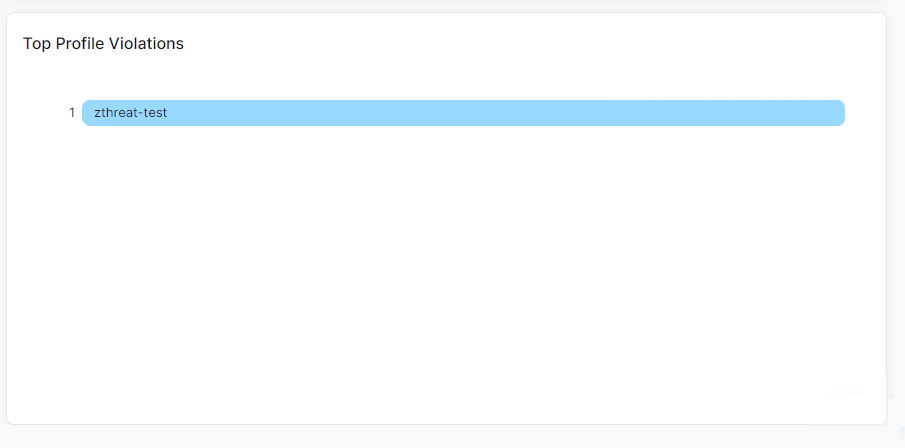
- Hover over a profile violation to view the following:
- Name: The profile violation name.
- Number of Top Profile Violation(s): The number of profile violations for the selected violation and the percentage of violations held within the top profile violations category.
- Click on a profile violation and then click View Logs to be directed to log information matching that profile violation in Web AppProtection Diagnostics.
- Hover over a profile violation to view the following:
