Experience Center
Viewing the API Protection Dashboard
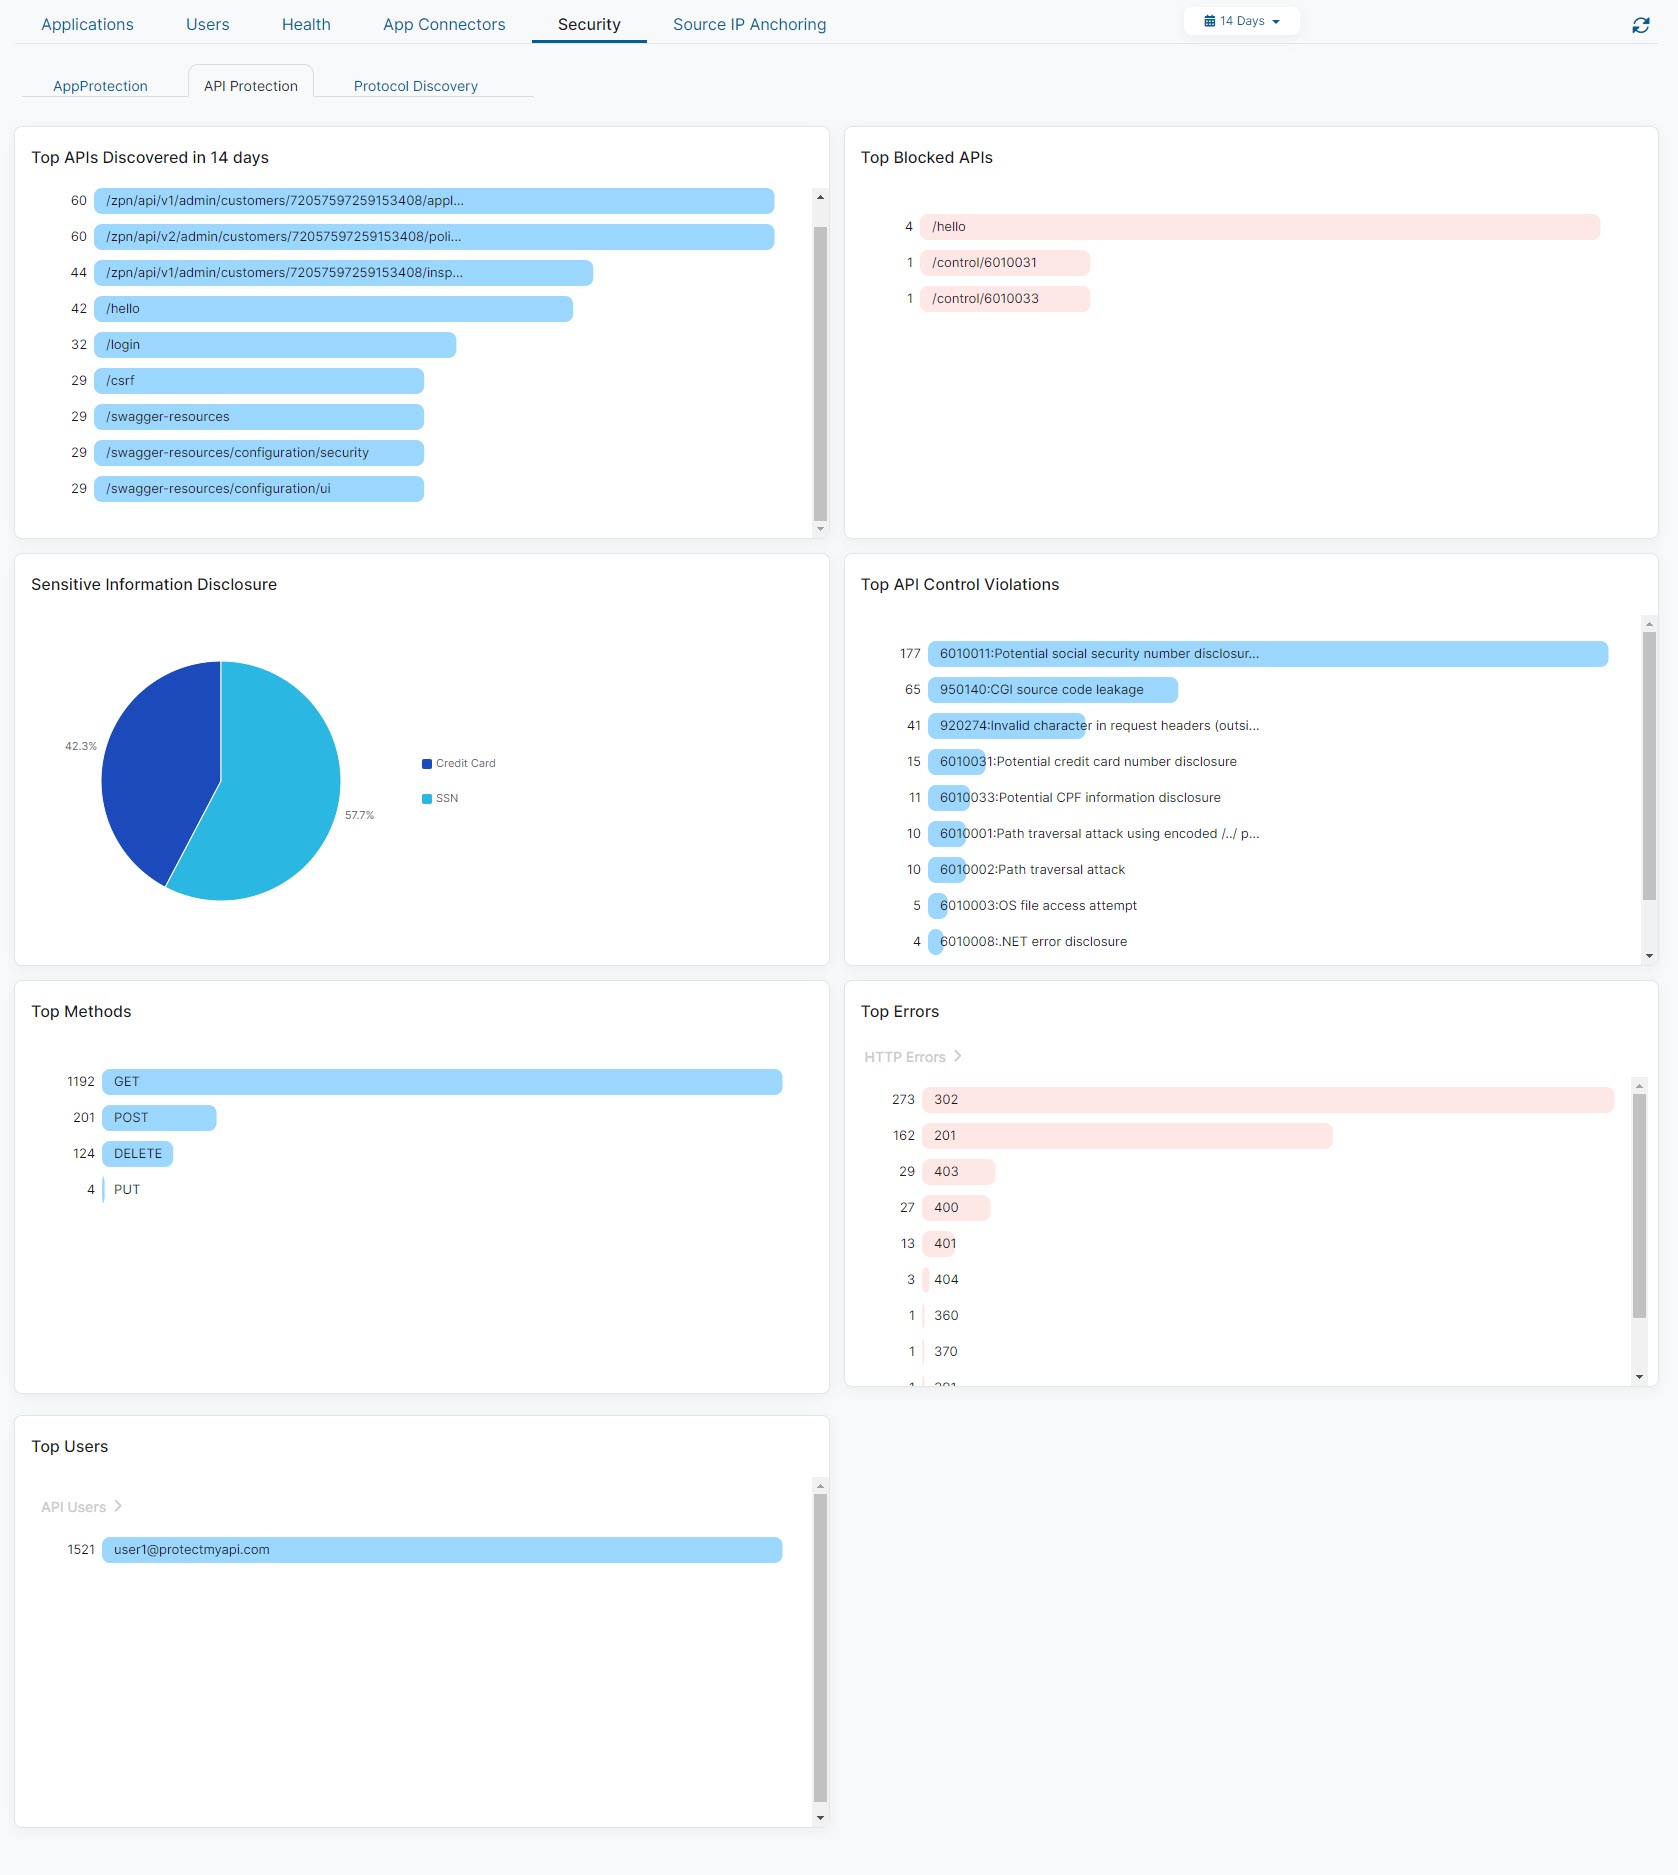
The API Protection dashboard provides information about the API Protection activity in your organization.
Dashboard Tools
The API Protection dashboard displays the following information and functionality:
- Time Range Filter: View AppProtection data over a period between 1 Hour to 14 Days, or you can select Custom Range. If you use a Custom Range, the start date must be within the last 14 days. The end date automatically sets to the system's current time. By default, the dashboard displays information for events that occurred in the last hour. This filter applies to all widgets on the dashboard.
- Refresh Icon: Refresh the dashboard to reflect the most current information.
- AppProtection Dashboard: View the AppProtection dashboard for more information about AppProtection policy activity.
- Browser Protection Dashboard: View the Browser Protection dashboard for information about browser sessions in your organization.

Widgets
The API Protection dashboard provides the following widgets:
- Top APIs Discovered in 14 Days
The widget displays the top 10 APIs discovered in the last 14 days. They are listed from the most frequent APIs discovered at the top to the less frequent APIs discovered at the bottom.
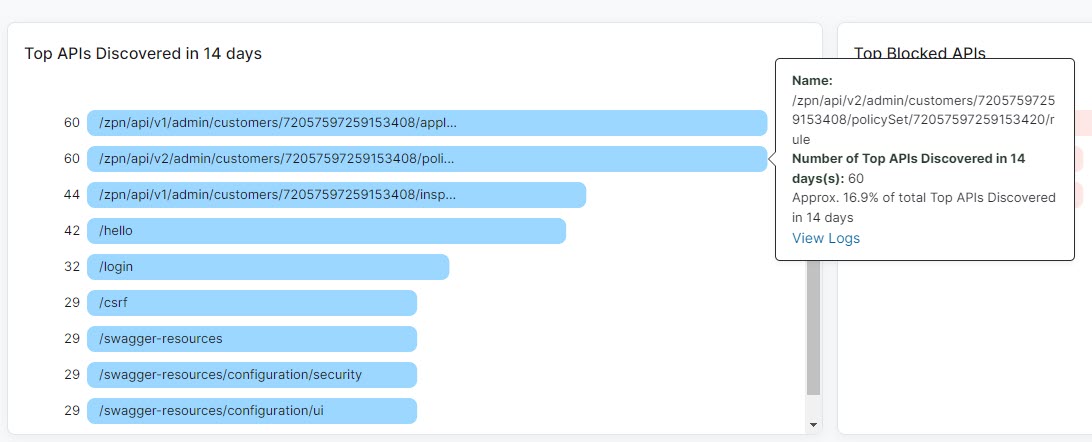
Hover over an API name to view the following:
- Name: The name of the API.
- Number of Top APIs Discovered in 14 Days: The amount of times the API appeared in the past 14 days and the percentage of times the API appeared within the Top APIs Discovered in 14 Days category.
Click an API name and then click View Logs to be directed to log information matching that API in API Protection Diagnostics.
Close - Top Blocked APIs
The widget displays the top 10 blocked APIs within the selected time frame. They are listed from the most frequent blocked APIs at the top to the less frequent APIs at the bottom.
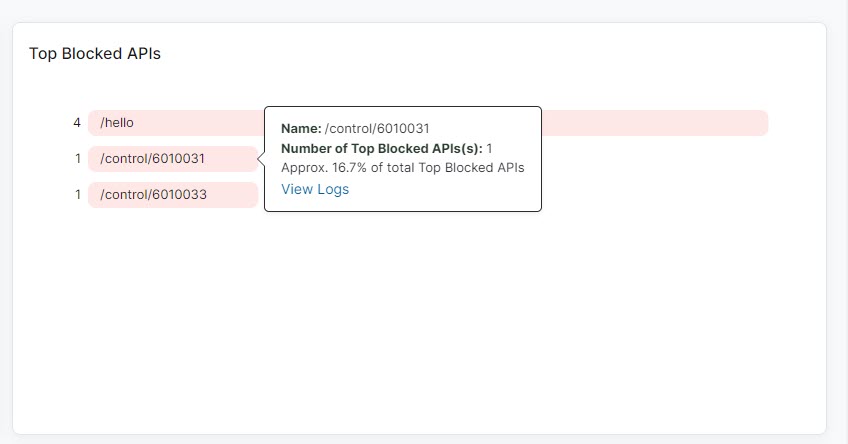
Hover over an API name to view the following:
- Name: The name of the API.
- Number of Top Blocked APIs: The amount of times the API appeared within the selected time frame and the percentage of times the API appeared within the Number of Top Blocked APIs category.
Click an API name and then click View Logs to be directed to log information matching that blocked API in API Protection Diagnostics.
Close - Sensitive Information Disclosure
The widget displays the amount of sensitive information categories (US social security numbers, Brazilian CPF numbers, and credit card numbers) in the selected time frame. Zscaler does not store the details or specific information; only the sensitive information category and how frequently it appeared in the time frame are stored.
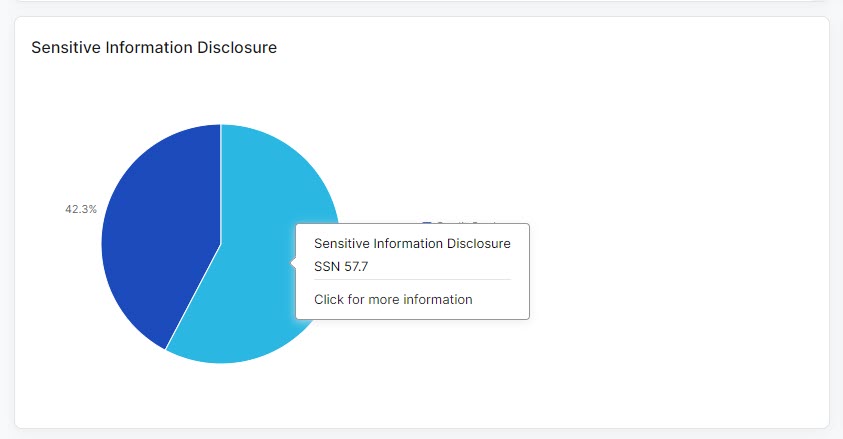
Hover over an area of the chart to view the following:
- Displays the percentage of sensitive information transactions that occurred within the selected time frame. Zscaler does not store the specific data for sensitive information, only the category type itself is stored.
- Click for more information: Click this option to show the View Logs option. Click View Logs to be directed to log data matching that disclosed sensitive information transaction in API Protection Diagnostics. Zscaler only displays the amount of transactions and does not store any details related to sensitive information.
- Top API Control Violations
The widget displays the top 10 API controls and their respective violations within the selected time frame. They are listed from the most frequent violations at the top to the less frequent violations at the bottom.
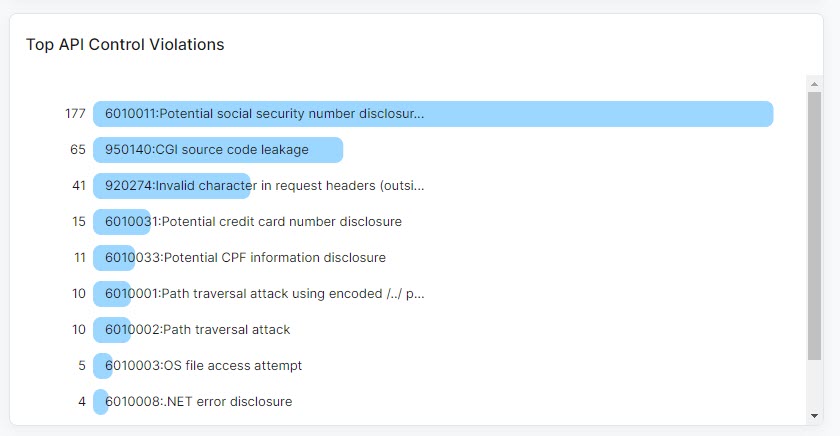
Hover over an area of the chart to view the following:
- Name: The name of the API control and the associated violation.
- Number of Top API Control Violations: The amount of times the violation with its related API control appeared within the selected time frame and the percentage of times the API control violation appeared within the Top API Control category.
Click an API control name and then click View Logs to be directed to log information matching that API control in API Protection Diagnostics.
Close - Top Methods
The widget displays the top 10 methods (i.e., GET, POST, PUT, etc.) for APIs within the selected time frame. They are listed from the most frequent method used at the top to the least frequent method used at the bottom.
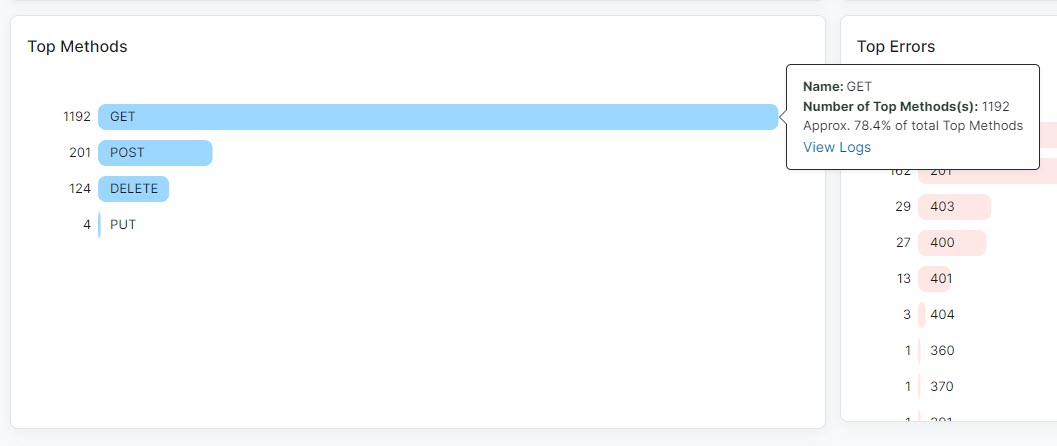
Hover over an area of the chart to view the following:
- Name: The name of the API method.
- Number of Top Methods: The amount of times the method was used within the selected time frame and the percentage of times the method appeared within the Top Methods category.
Click a method and then click View Logs to be directed to log information matching that API method in API Protection Diagnostics.
Close - Top Errors
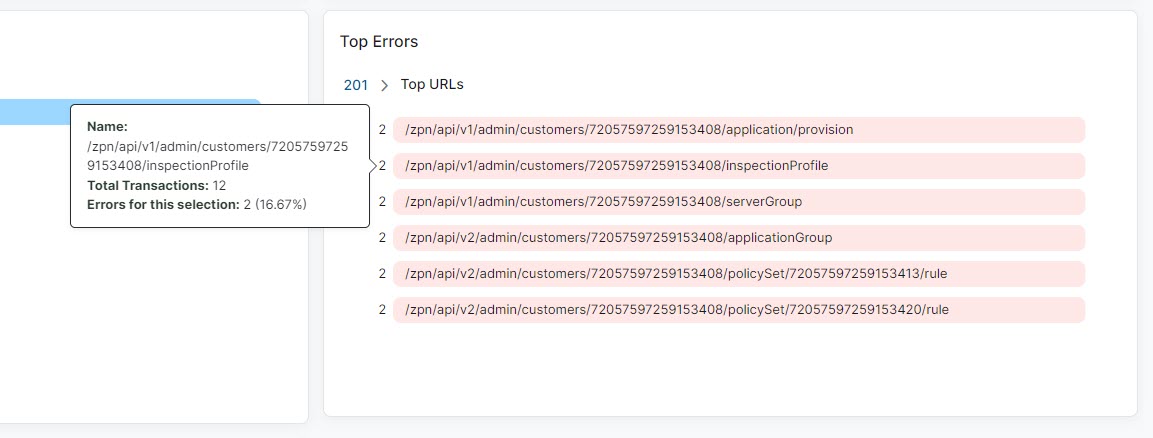
The widget displays the top 10 HTTP or HTTPS errors within the selected time frame. They are listed from the most frequent errors at the top to the least frequent errors at the bottom.
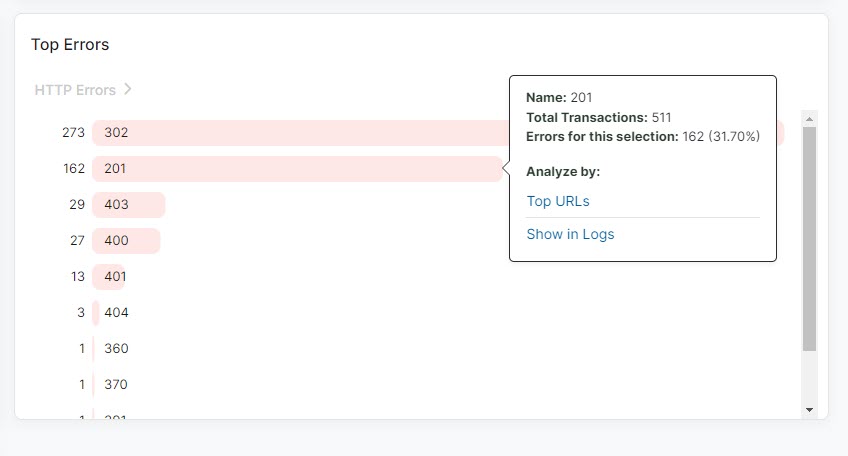
Hover over an area of the chart to view the following:
- Name: The name of the error.
- Total Transactions: The complete number of transactions for the selected error within the selected time frame.
- Errors for this selection: The total amount of that error type within the selected time frame and the percentage of times that error type appeared within the Top Methods category.
- Analyze by: Click Top URLs to gain deeper insight into the top URLs for a specific error type. This widget displays the top 10 URLs for a selected error type within the selected time frame. They are listed from the most frequent URLs at the top to the least frequent URLs at the bottom.
- Name: The name of the URL.
- Total Transactions: The complete number of error transactions for the selected URL within the selected time frame.
- Errors for this selection: The total amount of errors for the selected URL in the selected time frame and the percentage of times that the error for that URL appeared with the selected error type.
Click an error and then click Show in Logs to be directed to log information matching that API error in API Protection Diagnostics.
Close - Top Users
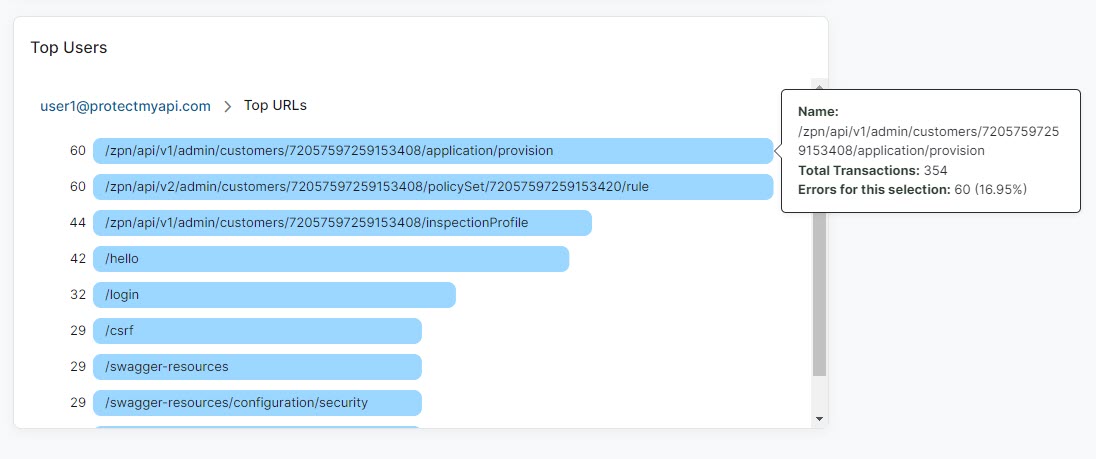
The widget displays the top 10 API users within the selected time frame. They are listed from the most frequent API users at the top to the least frequent API users at the bottom.
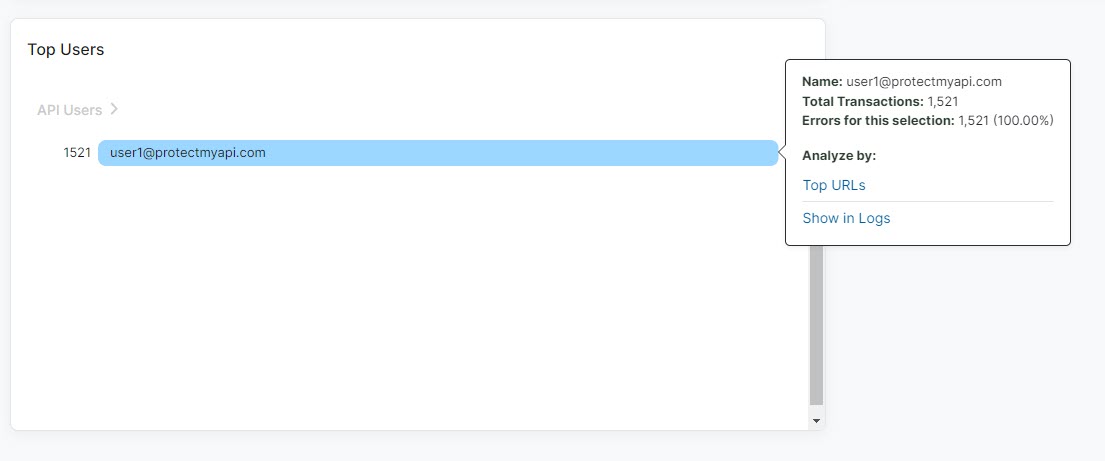
Hover over an area of the chart to view the following:
- Name: The IdP user name for the API user.
- Total Transactions: The complete number of transactions for that IdP user.
- Analyze by: Click Top URLs to gain deeper insight into the top URLs for a specific user. This widget displays the top 10 URLs for a selected user within the selected time frame. They are listed from the most frequent URLs at the top to the least frequent URLs at the bottom.
- Name: The name of the URL.
- Total Transactions: The complete number of transactions for the selected URL within the selected time frame.
Click an error and then click Show in Logs to be directed to log information matching that API error in API Protection Diagnostics.
Close
