Experience Center
Viewing the Active Directory Protection Dashboard
The Active Directory Protection dashboard provides information about the Active Directory policy activity in your organization.
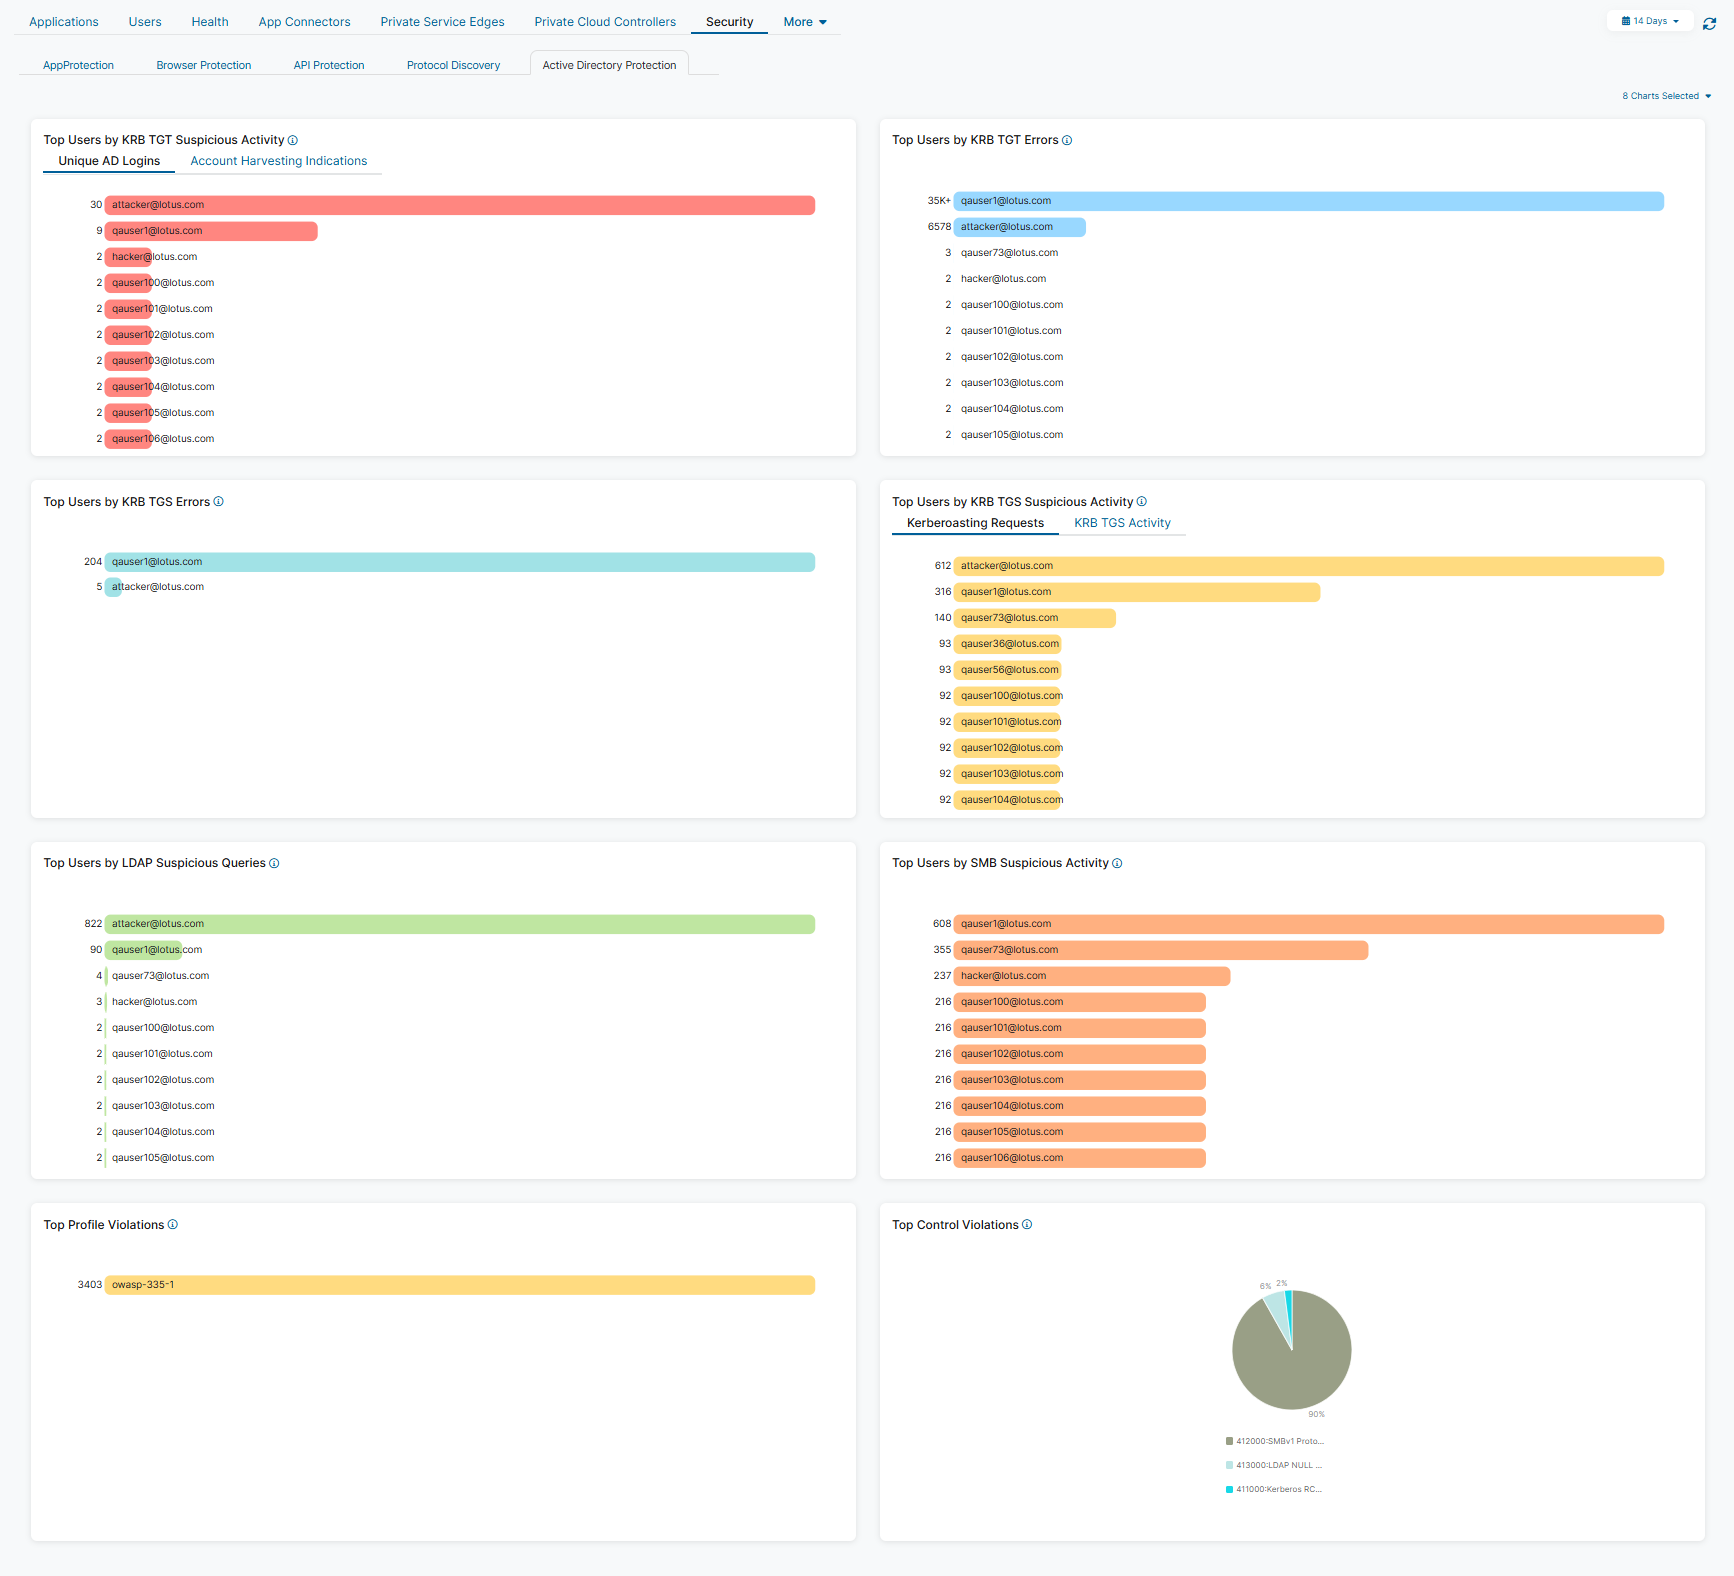
Dashboard Tools
The Active Directory Protection dashboard displays the following information and functionality:
- Time Range Filter: View Active Directory Protection data over a period between 1 Hour to 14 Days, or you can select Custom Range. If you use a Custom Range, the start date must be within the last 14 days. The end date automatically sets to the system's current time. By default, the dashboard displays information for events that occurred in the last hour. This filter applies to all widgets on the dashboard.
Log information in the dashboard is limited to 14 days. For longer access to the logs, use the Log Streaming Service (LSS).
- Refresh Icon: Refresh the dashboard to reflect the most current information.
- AppProtection Dashboard: View the AppProtection Dashboard for more information about AppProtection policy activity.
- Browser Protection Dashboard: View the Browser Protection Dashboard for information about browser sessions in your organization.
- API Protection Dashboard: View the API Protection Dashboard for information about API traffic in API protection controls. This tab is only visible if the feature is enabled in your account.
- Chart Selection Filter: Click the Chart Selection drop-down menu for a list of charts that displays Active Directory policy data. Select desired charts on the list to customize which charts are displayed or hidden on the dashboard.
Widgets
The Active Directory Protection dashboard provides the following widgets:
- Top Users by KRB TGT Suspicious Activity
The widget displays the top 10 Kerberos TGT suspicious activity within the selected time frame and lists them by user.
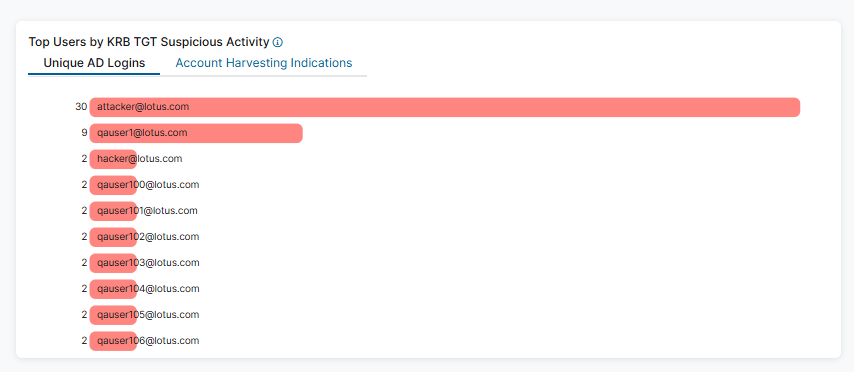
- Click on a tab to switch between a chart of unique Active Directory logins and a chart of account harvesting indications.
- Hover over a user to view the following:
- Name: The name of the user.
- Number of Top Users - KRB TGT Suspicious Activity: Depending on the chart you've selected:
- Unique Active Directory Logins: The number of unique Active Directory logins seen for the selected user. The percentage is the total unique Active Directory logins seen by that user within the top users for that category.
- Account Harvesting Indications: The number of Active Directory login failures seen for the selected user. The percentage is the Active Directory login failures seen by that user within the top users for that category.
- Click a user and then click View Logs to be directed to log information matching that user in Active Directory Protection Diagnostics.
- Top Users by KRB TGT Errors
The widget displays the top 10 Kerberos TGT errors within the selected time frame and lists them by user. The error counts displayed do not include these common errors:
- KDC_ERR_PREAUTH_REQUIRED (25)
- KRB_AP_ERR_TKT_EXPIRED (32)
- KRB_ERR_RESPONSE_TOO_BIG (52)
- KDC_ERR_BADOPTION (13)
- KDC_ERR_NEVER_VALID (11)
- KRB_AP_ERR_SKEW (37)
- KDC_ERR_ETYPE_NOSUPP (14)
- KDC_ERR_S_PRINCIPAL_UNKNOWN (7)
- KRB_AP_ERR_MODIFIED (41)
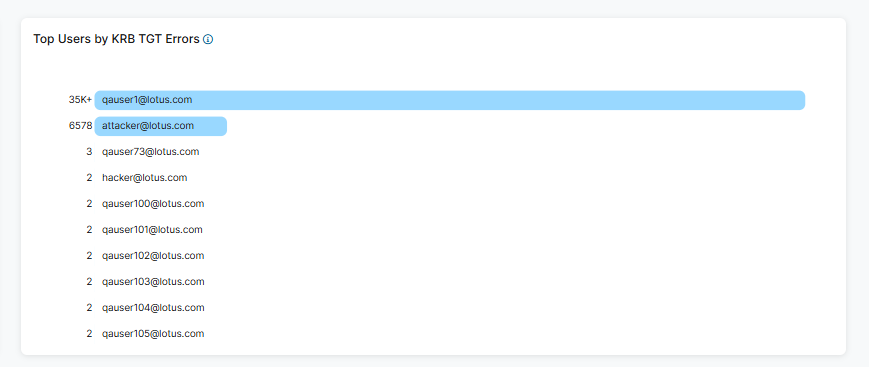
- Hover over a user to view the following:
- Name: The name of the user.
- Number of Top Users by KRB TGT Error(s): The number of errors for the selected user. The percentage is the errors held by that user within the top users for that category.
- Click a user and then click View Logs to be directed to log information matching that user in Active Directory Protection Diagnostics.
- Top Users by KRB TGS Errors
The widget displays the top 10 Kerberos TGS errors within the selected time frame and lists them by user. The error counts displayed do not include these common errors:
- KDC_ERR_PREAUTH_REQUIRED (25)
- KRB_AP_ERR_TKT_EXPIRED (32)
- KRB_ERR_RESPONSE_TOO_BIG (52)
- KDC_ERR_BADOPTION (13)
- KDC_ERR_NEVER_VALID (11)
- KRB_AP_ERR_SKEW (37)
- KDC_ERR_ETYPE_NOSUPP (14)
- KDC_ERR_S_PRINCIPAL_UNKNOWN (7)
- KRB_AP_ERR_MODIFIED (41)
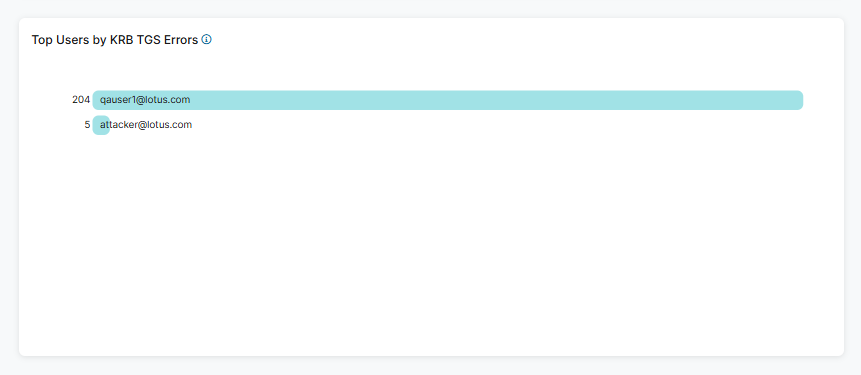
- Hover over a user to view the following:
- Name: The name of the user.
- Number of Top Users by KRB TGS Errors: The number of errors for the selected user. The percentage is the errors held by that user within the top users for that category.
- Click a user and then click View Logs to be directed to log information matching that user in Active Directory Protection Diagnostics.
- Top Users by KRB TGS Suspicious Activity
The widget displays the top 10 Kerberos TGS suspicious activity within the selected time frame and lists them by user.
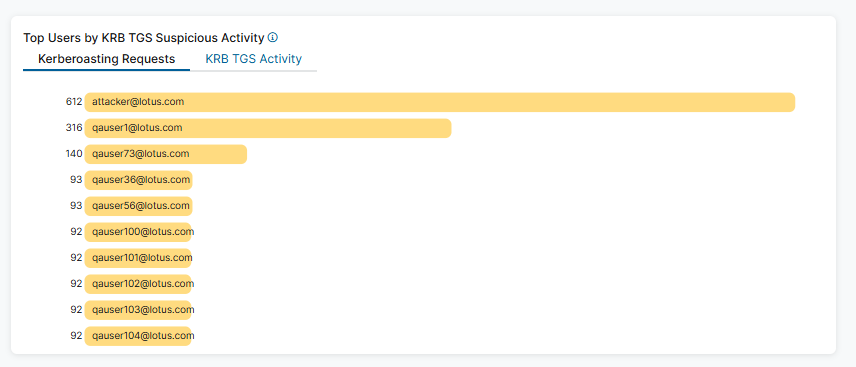
- Click a tab to switch between a chart of Kerberoasting requests and a chart of Kerberos TGS activity.
- Hover over a user to view the following:
- Name: The name of the user.
- Number of Top Users by KRB TGS Suspicious Activity: Depending on the chart you've selected:
- Kerberoasting Requests: The number of instances the user requested a ticket with a weak encryption (e.g., RC4 and DES encryption). The percentage is the total Kerberoasting requests held by that user within the top users for that category.
- KRB TGS Activity: The number of instances where the user sends a TGS request for various services in Active Directory domain. The percentage is the total Kerberos TGS activity held by that user within the top users for that category.
- Click a section of the chart and then click View Logs to be directed to log information matching the control category in Active Directory Protection Diagnostics.
- Top Users by LDAP Suspicious Queries
The widget displays the top 10 LDAP suspicious queries within the selected time frame and lists them by user.
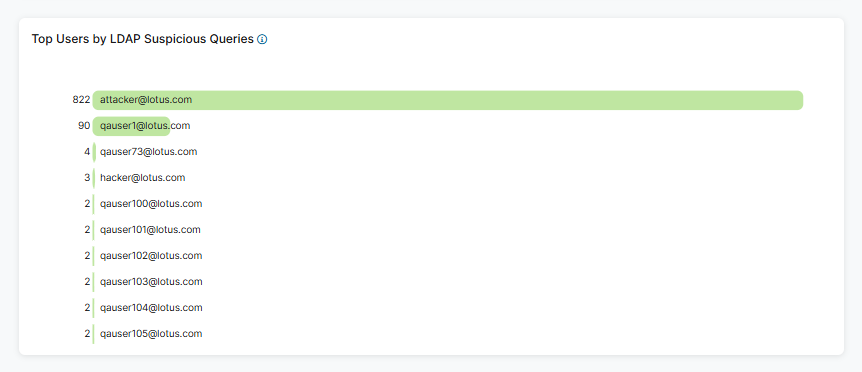
- Hover over a user to view the following:
- Name: The name of the user.
- Number of Top Users by LDAP Suspicious Activity: The number of suspicious queries for the selected user. The percentage is suspicious queries held by that user within the top users for that category.
- Click a user and then click View Logs to be directed to log information matching that user in Active Directory Protection Diagnostics.
- Hover over a user to view the following:
- Top Users by SMB Suspicious Activity
The widget displays the top 10 SMB suspicious activity within the selected time frame and lists them by user. This activity data consists of session and user enumeration.
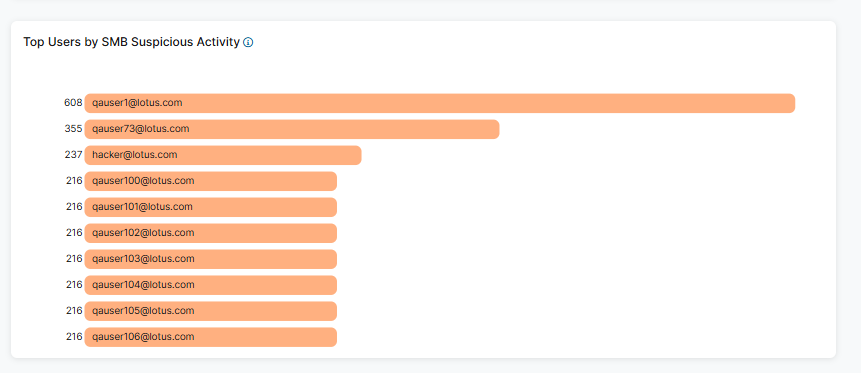
- Hover over a user to view the following:
- Name: The name of the user.
- Number of Top Users by SMB Suspicious Activity: The number of suspicious activity for the selected user. The percentage is suspicious activity held by that user within the top users for that category.
- Click a section of the chart and then click View Logs to be directed to log information matching the control category in Active Directory Protection Diagnostics.
- Hover over a user to view the following:
- Top Profile Violations
The widget displays the top 10 profile violations within the selected time frame and lists them by name.
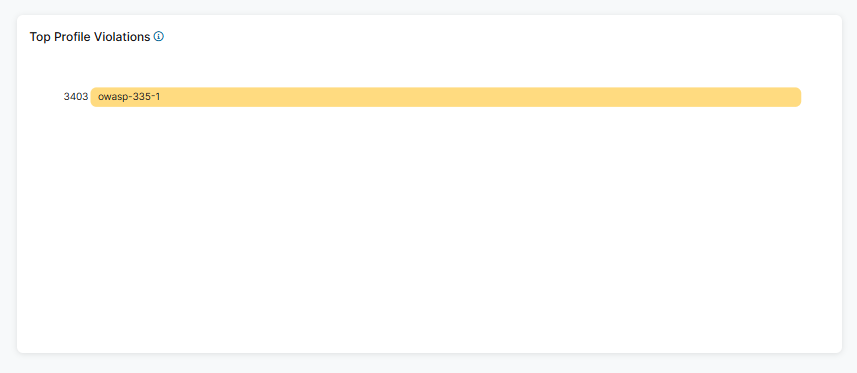
- Hover over a violation to view the following:
- Name: The profile violation name.
- Number of Top Profile Violation(s): The number of profile violations for the selected violation. The percentage is violations held within the category.
- Click a profile violation and then click View Logs to be directed to log information matching that violation in Active Directory Protection Diagnostics.
- Hover over a violation to view the following:
- Top Control Violations
This widget displays the top 10 control violations within the selected time frame and categorizes them by name. The top control violations are categorized by control number and name, in the ControlNumber:ControlName format.
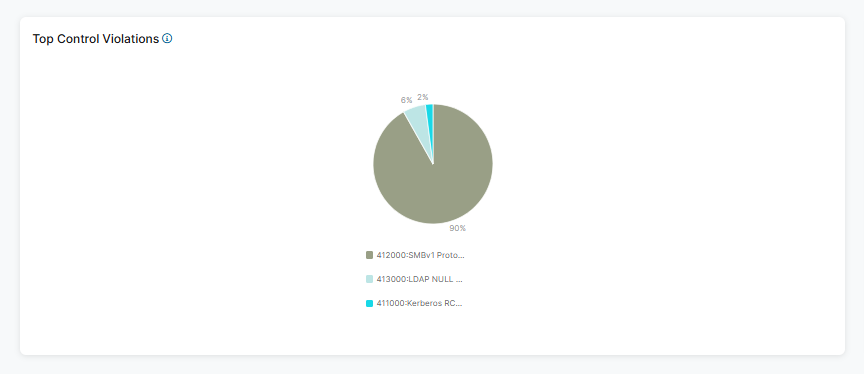
Hover over a section of the chart to view the name of the control violation and the percentage of control violations held within the Top Control Violations category.
Close - Top Users by Control Violations
The widget displays the top 10 users by control violations within the selected time frame and lists them by user.
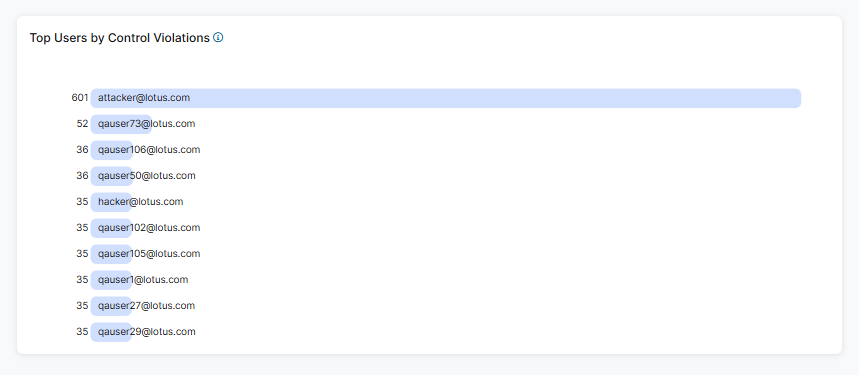
- Hover over a user to view the following:
- Name: The name of the user.
- Number of Top Users by Control Violation(s): The top users with their number of control violations. The percentage is control violations held by that user within the top users for that category.
- Click a user and then click View Logs to be directed to log information matching that user in Active Directory Protection Diagnostics.
- Hover over a user to view the following: