Experience Center
Viewing the Protocol Discovery Dashboard
The Protocol Discovery dashboard displays protocols (KRB, LDAP, SMB, HTTP, and TLS) detected for domains with application segments that have AppProtection disabled. You can enable AppProtection for the application segment when you click on the application segment, the listed domains, and the ports and protocols mapped to it. The Protocol Discovery dashboard displays up to 100 of a domain's most recent transactions and 6,000 application segments for the time range selected.
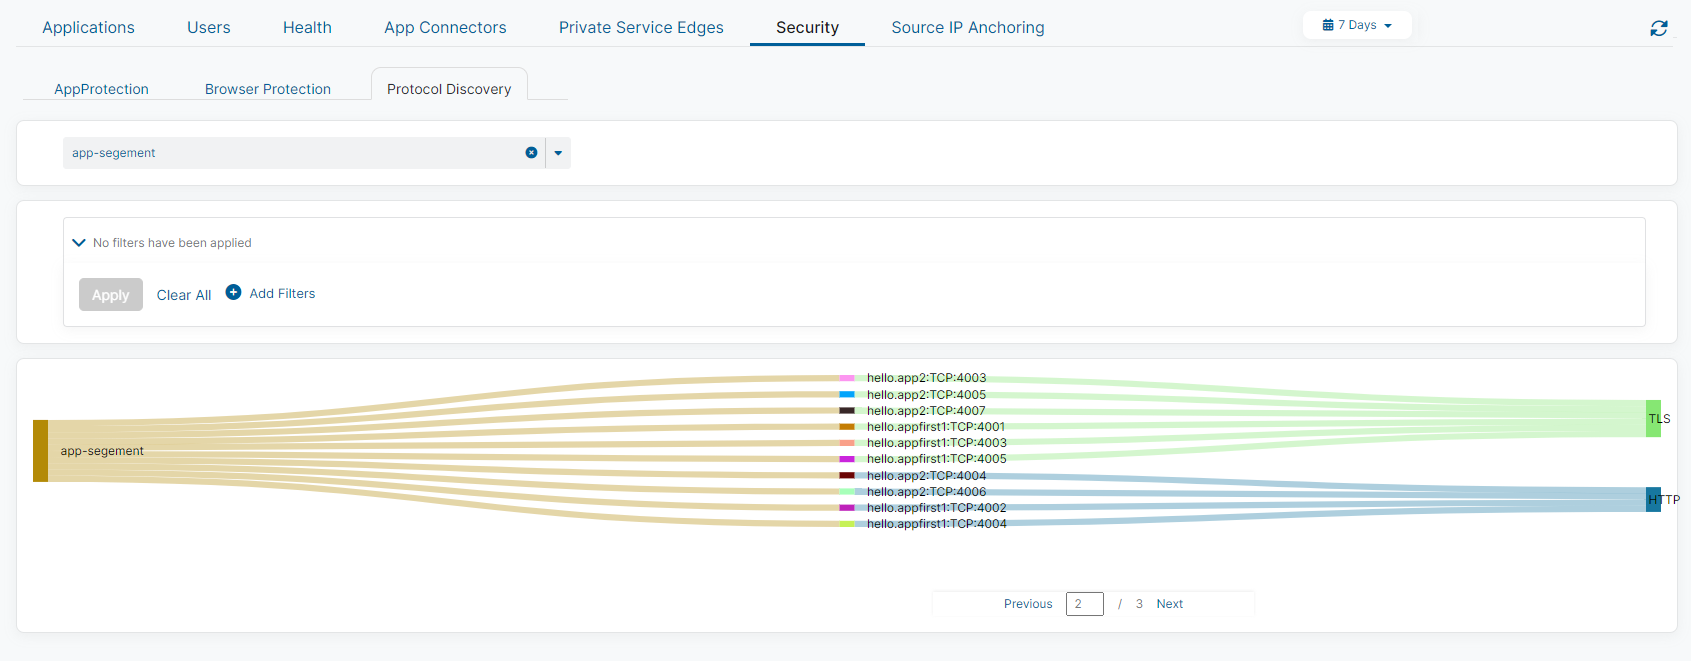
Dashboard Tools
The AppProtection dashboard displays the following information and functionality:
- Time Range Filter: View Protocol Discovery data over a period between 1 hour to 7 days, or you can select Custom Range. If you use a Custom Range, the start date must be within the last 7 days. The end date automatically sets to the system's current time. By default, the dashboard displays information for events that occurred in the last hour.
- Refresh Icon: Refresh the dashboard to reflect the most current information.
- AppProtection Dashboard: View the AppProtection page for information about AppProtection policy activity in your organization.
- Browser Protection Dashboard: View the Browser Protection page for information about browser sessions in your organization.

Protocol Discovery Widget
You can select the application segment that you want displayed from the drop-down menu. You can enter a keyword to search by domain within the displayed application segment.

Enabling AppProtection for an Application Segment
If you haven't enabled AppProtection for the displayed application segment and want to inspect it, follow these steps:
- Click on the displayed application segment or any of its related items (domain, port, or protocol).
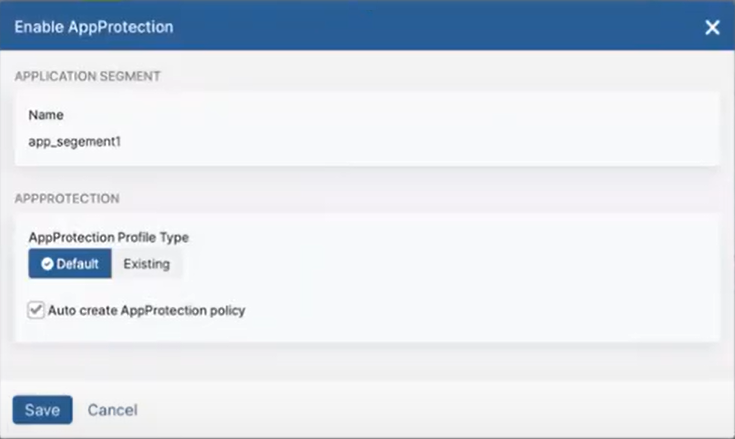
- When you click one of the displayed items, the Enable AppProtection window appears. If the application segment doesn't include domains that have AppProtection enabled, and an AppProtection profile and policy don't already exist, you can adjust the AppProtection Profile Type and select the Auto create an AppProtection policy checkbox.
- When you are finished, click Save. A confirmation message appears notifying you that you have successfully updated the application segment.
Make sure you also generate the AppProtection enrollment (CA) certificate to use the AppProtection feature. If you haven't already generated the certificate, then another pop-up window appears to generate the certificate.
You can view the adjusted application segments on the Defined Application Segments page.
Inspect Application Segments
To inspect at the application segment level:
- Click on the displayed application segment.
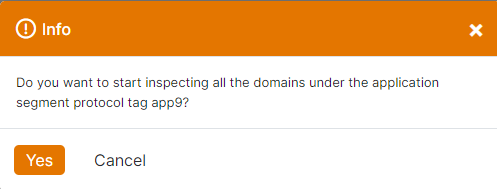
- After you have clicked on the application segment, a pop-up message appears to confirm if you want to enable inspection for the application segment.
- If you want to continue with inspection of the entire application segment, click Yes. The application segment is then inspected. A confirmation message appears notifying you that you have successfully updated the application segment.
- If you don't want to inspect all of the application segment, click Cancel. You can go to the Defined Application page and edit the application segment to adjust the domain and related ports.
Inspect Domains and Ports
To inspect at the domain or port level:
- Click one of the displayed domains or ports.
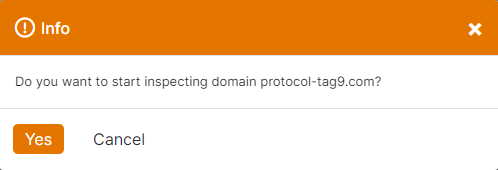
- After you have clicked a domain or port, a pop-up message appears to confirm if you want to enable inspection for all of the UDP and TCP ports assigned to the application segment associated with the selected domain.
- If you want to continue with inspection of all the ports, click Yes. The domain and its related ports for the related application segment are then inspected. A confirmation message appears notifying you that you have successfully updated the application segment.
- If you don't want to inspect all of the current ports for the application segment that the domain is associated with, click Cancel. You can go to the Defined Application page and edit the application segment to adjust the domain and related ports. Protocol Discovery allows AppProtection to be enabled for a domain with a single port or for all of the TCP/UDP ports configured with the application segment. If you have successfully enabled inspection for only one domain, when you refresh the page, if you click the same domain but with a different port than the one that you inspected, you are prompted to enable inspection on all the ports for that domain.
Inspect Protocols
To inspect at the protocol level:
- Click one of the listed protocols.
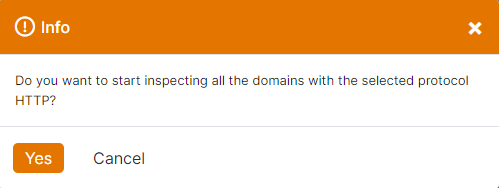
- When you have clicked a protocol, a pop-up message appears to confirm if you want to enable inspection for that specific protocol of the application segment displayed. If you want to continue, click Yes. A confirmation message appears notifying you that you have successfully updated the application segment.
- After inspection has been enabled, the items that have been selected for inspection are removed from the widget.
