Experience Center
Evaluating Individual Alert Details
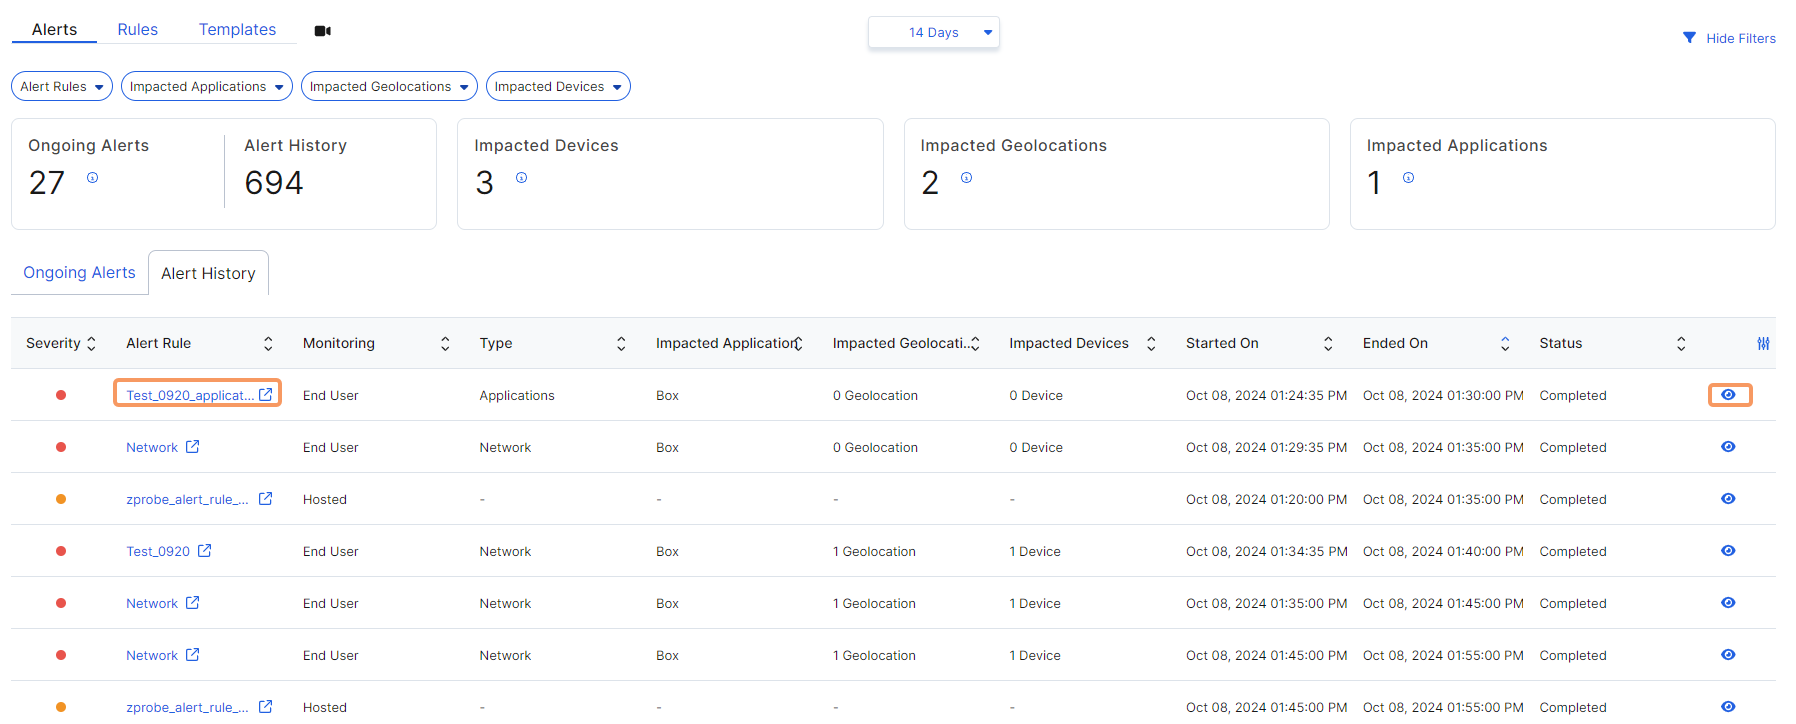
Individual alert details provide in-depth information about the impacted devices and their respective departments and locations. To view individual alert details on the Alerts page, click the Rule Name or the View icon of a selected alert. Depending on the type of monitoring you selected for the alert, the alert details differ.
End User Monitoring
If an alert was configured to monitor end users, the Alert Details page shows the following:
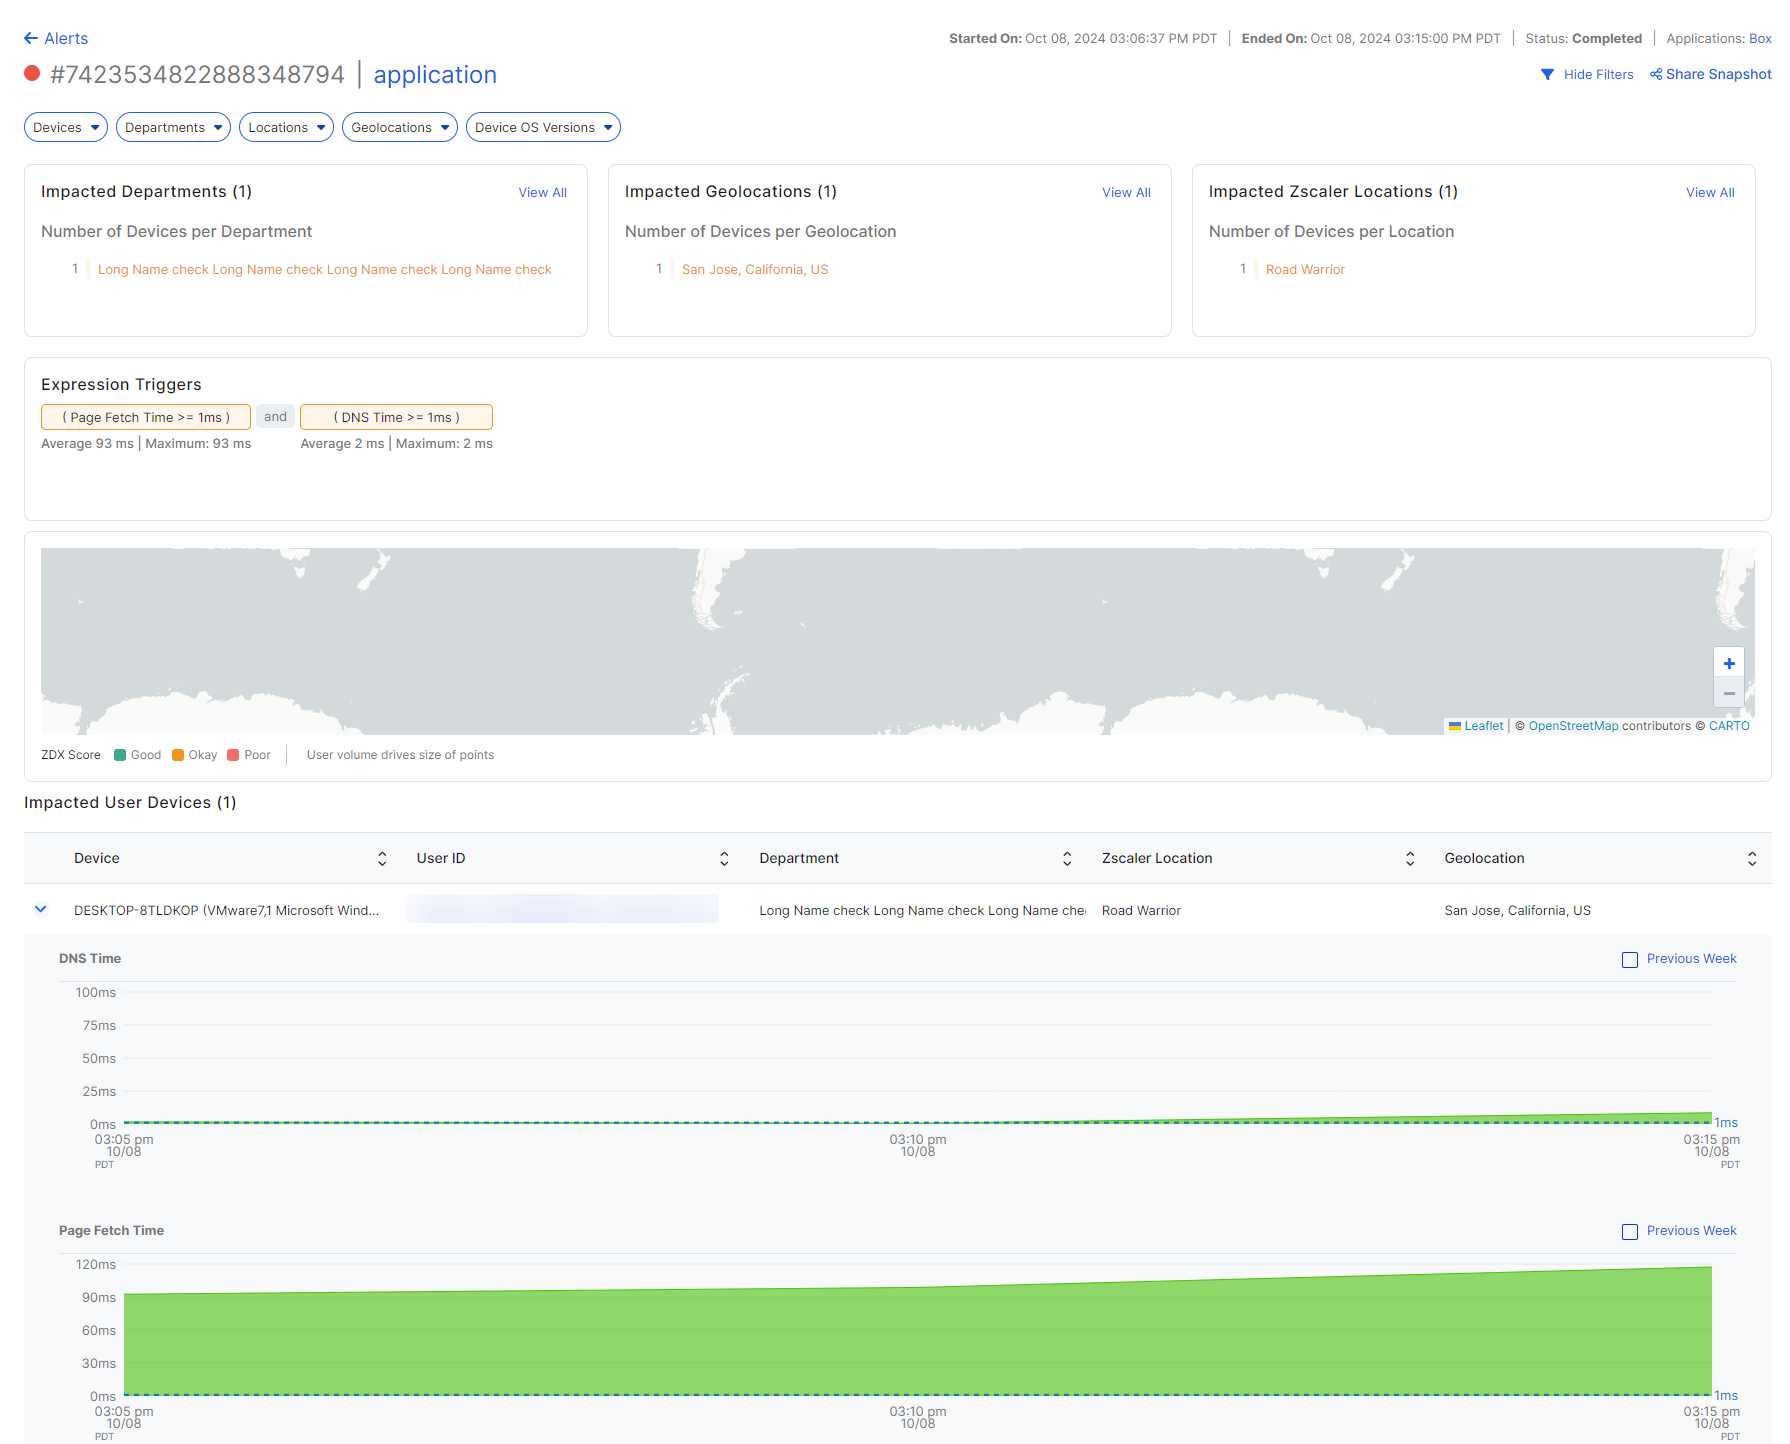
Impacted Departments: The number of devices by department and the total number of impacted devices. Click View All to view all the impacted departments in a dialog window.
Impacted Geolocations: The number of devices by geolocation and the total number of impacted geolocations. Click View All to view all the impacted geolocations in a dialog window.
Impacted Zscaler Locations: The number of devices by location and the total number of impacted locations. Click View All to view all impacted locations in a dialog window.
- Expression Triggers: The alert rule's expression triggers as well as the average and maximum values for the time period.
The maximum number of devices displayed on the Alert Details page is up to 128 devices. In the View All dialog window, the maximum number of devices displayed is up to 6,000 devices.
The Impacted Geolocations map displays the location of the impacted user devices. The map has the following functionality:
| Map Interaction | Results |
| Click Filter Unknown Locations | The global filter and all widgets are updated with this selection. |
| Hover over a pin | View a tooltip with the geolocation and number of users. |
| Click a pin | The global filter and all widgets are updated with this selection. |
| Click the tooltip | The tooltip remains open. |
| Double-click a pin | Zoom in to the map to view details. |
| Zoom in/out on a pin | Zoom in to the map to view details. |
| Drag the map | Data is displayed as per the map boundary. No additional interaction or data is loaded. |
| Draw a fence around a pin and then click Filter Selection. | The global filter and all widgets are updated with this selection. To learn more, see Drawing a Fence. |
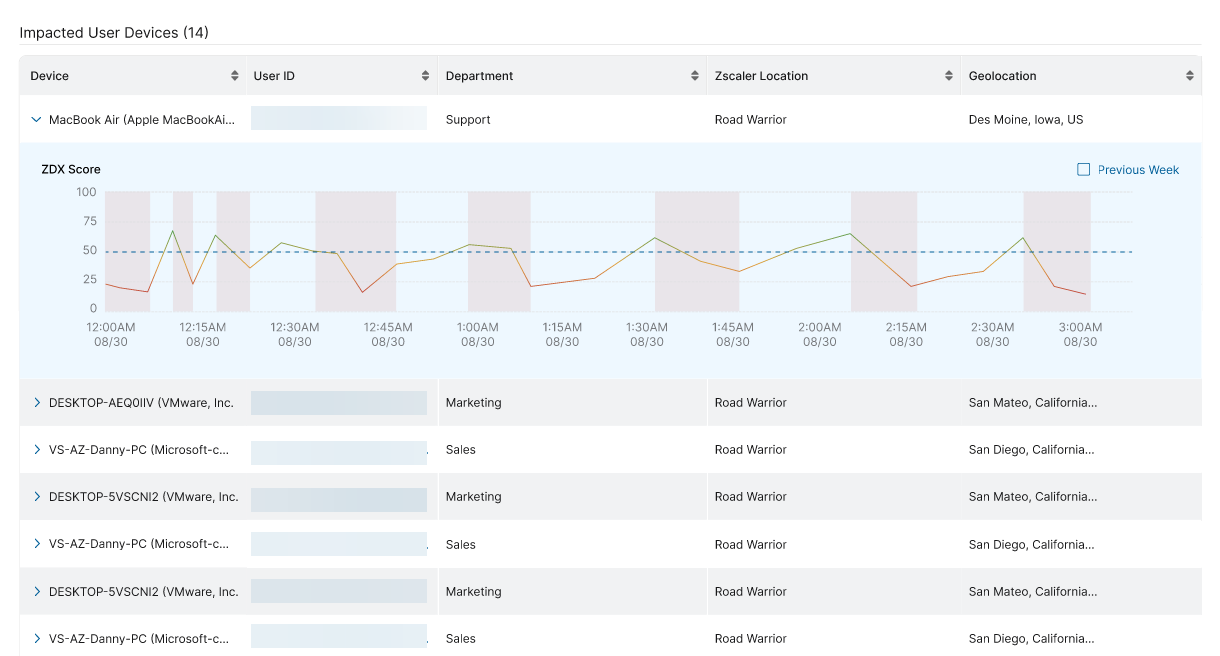
The Impacted User Devices table displays the Device name, User ID, Department, Zscaler location, Geolocation, and the ZDX Score of the device.
The ZDX Score includes an auto-baseline score based on historical data and a ZDX Score drop detection based on threshold sensitivity.
The dotted reference line is based on the criteria set from configuring an alert rule.
Click the Expand or Collapse icon to the left of the device name to view details of that individual device.
Hosted Monitoring
If an alert was configured using a hosted probe, the Alert Details page shows the following:
- Alert Details include the following information:
- Status: The status of the alert. To learn more, see Understanding the Alert Status.
- Severity: The severity level of the event. Red indicates High severity, orange is Medium severity, and green indicates Low severity.
- Monitoring Type: The type of monitoring for this rule. End User indicates the alert rule was created by the user. Hosted indicates the alert rule was created for Zscaler Hosted Monitoring.
- Probe: The name of the probe.
- Criteria: The selected criteria for the alert rule.
- Started On: The date and time this alert was triggered.
- Ended On: The date and time this alert ended.
- Depending on the selected criteria for the alert, you can view the associated details such as latency, number of hops, packet loss, or DNS Time from the selected Zscaler Hosted probe. To learn more, see Understanding Zscaler Hosted Monitoring.
Dynamic Alert
Dynamic alerting provides the ability to auto-baseline by referring to historical data to create the current baselines and detect ZDX Score drops based on your threshold sensitivity to be notified on critical changes. To configure a dynamic alert, see Configuring an Alert Rule.
After an alert rule is created and completed with the ZDX Score Drops as the criteria, you can see the ZDX Score drops of the impacted device.
- The dotted line indicates the reference line for threshold sensitivity based on your criteria.
- The gradient line indicates the ZDX Score over time.
- The shaded region indicates when the ZDX Score drops from the reference line.


