Experience Center
About Alerts
Alerts provide a primary and timely source of information to monitor device, application, network performance, and ZDX Score on the Alerts page so that you can analyze and remediate issues.
Alerts provide the following benefits and enable you to:
- Receive and review in-depth alert details in the Admin Portal or triggered alerts that are sent via emails and webhooks based on the ranges and limitations.
- Create configurable alert rules that are triggered when a preset threshold is reached for different types of events.
In the Admin Portal, you can view alerts triggered over the past two weeks. You can select options from 2 hours to 14 days in the time range filter to view triggered alerts in the Alert History tab. To learn more, see Triggering an Alert.
The alerts triggered have a display delay of 30 minutes.
The Alerts page shows the following functionality:
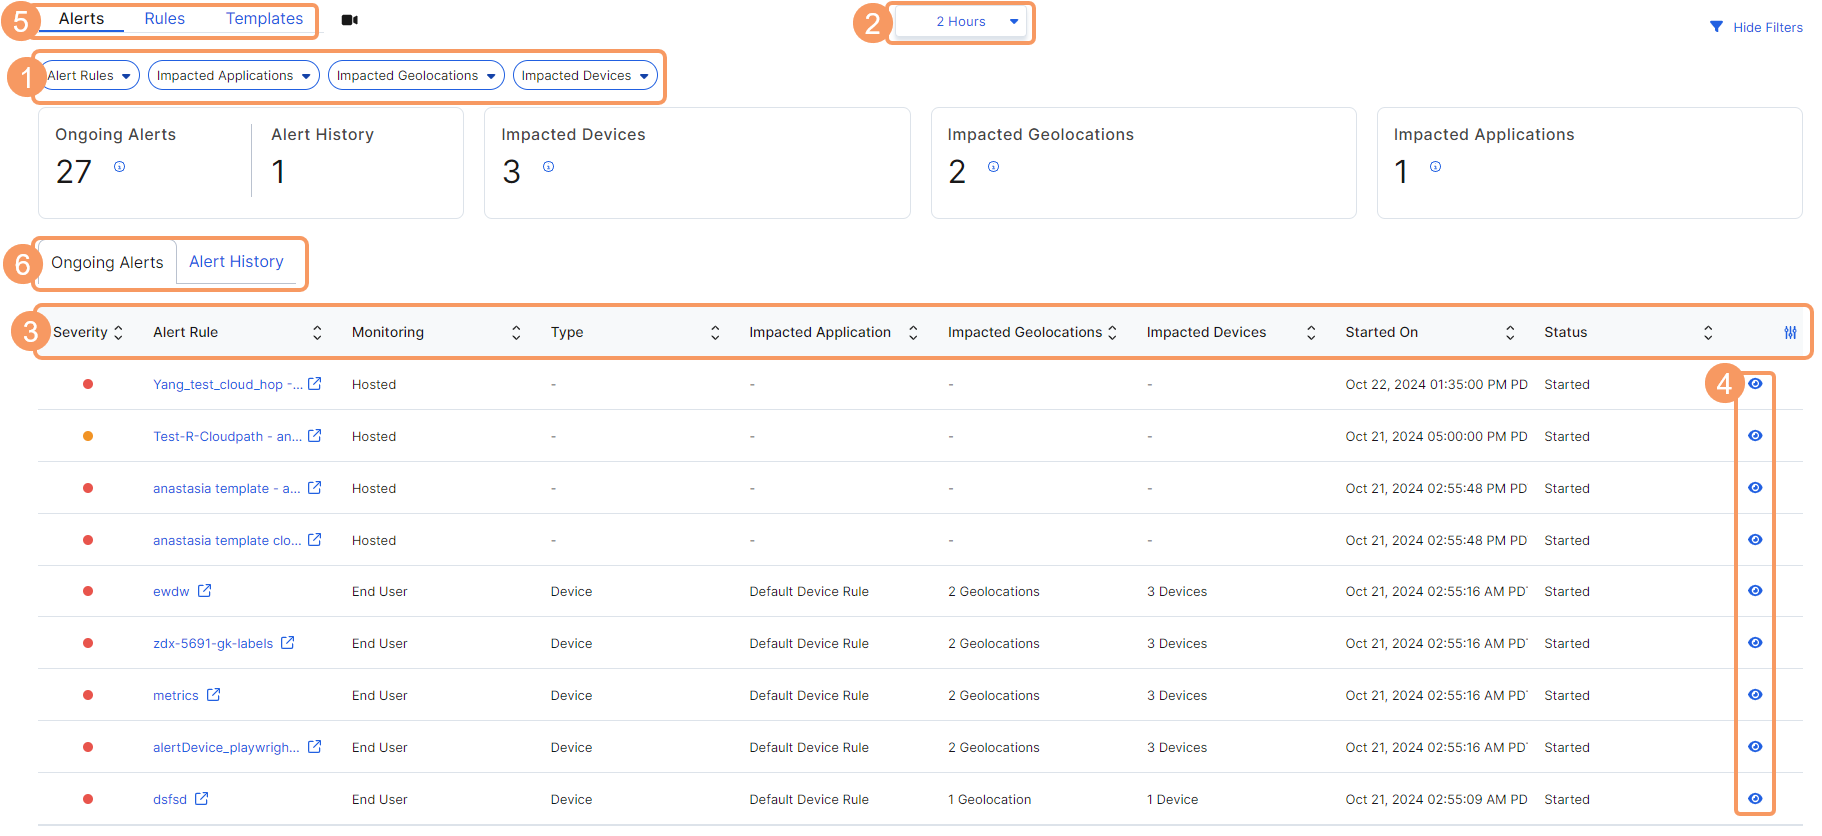
- Alert Rules, Impacted Devices and Impacted Applications filters: Apply filters to drill down further into the data. By default, all filters are applied and the values are set to All.
- Time Range filter: At the top of the page, select the time (2 Hours to 14 Days) from the drop-down menu. This filter applies to the Alert History tab, which shows historical details over the time selected. The default time range is 2 Hours.
- Compare Alerts: Click the Open in a New Tab icon next to the alert name. You can use this icon to open multiple alerts and compare their details.
If you configure an alert rule by ZDX Score, depending on how you choose to group the scoring, these filters and icons are displayed. To learn more, see Configuring an Alert Rule.
About the Alerts Page
On the Alerts page (Administration > Alerts > Alerts), you can do the following:
- Use the filters to sort and view alerts.
- Use the time range filter to help narrow your scope of information. Time range options are available in increments from the previous 2 Hours to 48 Hours, or a Custom range within the last 14 Days.
View details of the alerts triggered in the Admin Portal. The Ongoing Alerts tab displays ongoing alerts, and the Alert History tab displays historical alert details over the time selected. You can view the following for all the configured alerts:
- Severity: The severity level of the event. Red indicates High severity, orange is Medium severity, and green indicates Low severity.
- Alert Rule: The name entered for this rule from configuration.
- Monitoring: The type of monitoring for this rule. End User indicates the alert rule was created by the user. Hosted indicates the alert rule was created for Zscaler Hosted Monitoring.
- Type: The type is Application, Network, or Device.
- Impacted Application: The application impacted by this alert.
- Impacted Geolocation: The geolocation impacted by this alert.
- Impacted Devices: The devices impacted by this alert.
- Started On: The date and time this alert was triggered.
- Ended On: The date and time this alert ended. This column is on the Alert History tab.
- Status: The status of the alert. To learn more, see Understanding the Alert Status.
By default, the Alerts are sorted by the Started On column, but you can sort any of the columns by clicking the arrows next to them.
- View details about an alert by clicking the View icon. To learn more, see Evaluating Individual Alert Details.
- Access the navigation menu to go to the following pages:
- Switch the view to see Ongoing Alerts or Alert History.
