Experience Center
Viewing System-Generated Reports
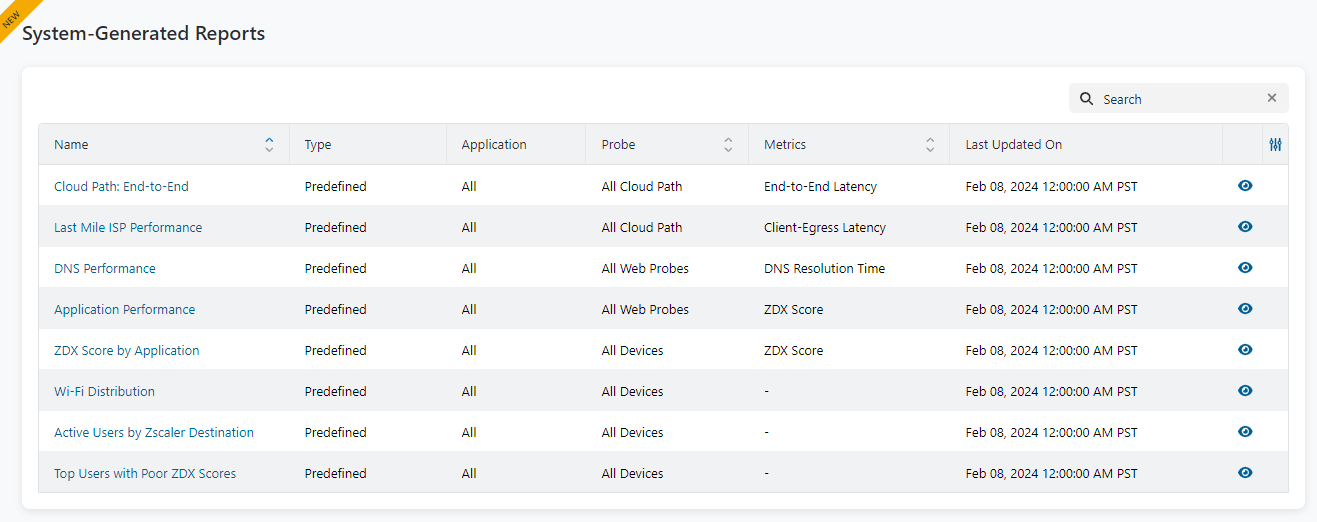
System-generated reports allow you to view user data across your organization that can reveal distinctive patterns among various metrics and applications. Details for each report are aggregated day-to-day and most reports are captured in a rolling 14-day cycle.
Prerequisites
To access and view system-generated reports, ensure:
- Your Digital Experience Monitoring subscription level supports viewing system-generated reports. To learn more, see Ranges & Limitations.
- Your admin role is configured to view system-generated reports. To learn more, see Adding Digital Experience Monitoring Roles.
Accessing Reports
You can access the reports from the left-side navigation of the Admin Portal:
- Go to Analytics > Digital Experience Management > Reporting > System Generated Reports.
- Select the report name or click the View icon to access a report.
Use the search field to find a specific report. Search for any character string that might be part of the report name.
The report table provides the following information:
- Name: The name of the system-generated report.
- Type: Indicates the report is either predefined or defined by the user.
- Application: Indicates either a particular application or all applications.
- Probe: Specifies either Cloud Path or Web Probes.
- Metrics: Identifies the type of metrics reflected in the report.
- Last Updated On: Indicates the date and time when the report was revised.
Viewing Report Details
View details for each of the following system-generated reports:
- Cloud Path: End-to-End
The End-to-End Latency report captures the average latency in the Cloud Path within a 14-day time range.
Similar to other system-generated reports, you can view a more granular time range:
- Select a point in the graph. A tooltip displays the latency metrics for the selected locations.
- Drag your mouse from left-to-right to capture your time range. The graph automatically adjusts to show the latency within the new time line.
- Click Zoom Out to reset the graph back to the original view.
Up to 20 device locations are displayed at a time within the legend on the right side of the graph, based on user device information. Each location is color-coded to correspond to its trend line within the graph, with the number of devices per location included in parentheses. A minimum of one location is always displayed. The P95 line is calculated based on the latency of the selected locations.
Close
- Last Mile ISP Performance
The Last Mile ISP Performance report captures ISP latency within a 14-day time range.
Similar to other system-generated reports, you can view a more granular time range:
- Select a point in the graph. A tooltip displays the latency metrics for the selected ISPs.
- Drag your mouse from left-to-right to capture your time range. The graph automatically adjusts to show the latency within the new time line.
- Click Zoom Out to reset the graph back to the original view.
Up to 20 ISPs are displayed at a time within the legend on the right side of the graph, based on the ISPs to which your users are connecting. Each ISP is color-coded to correspond to its trend line within the graph. A minimum of one ISP is always displayed.
Close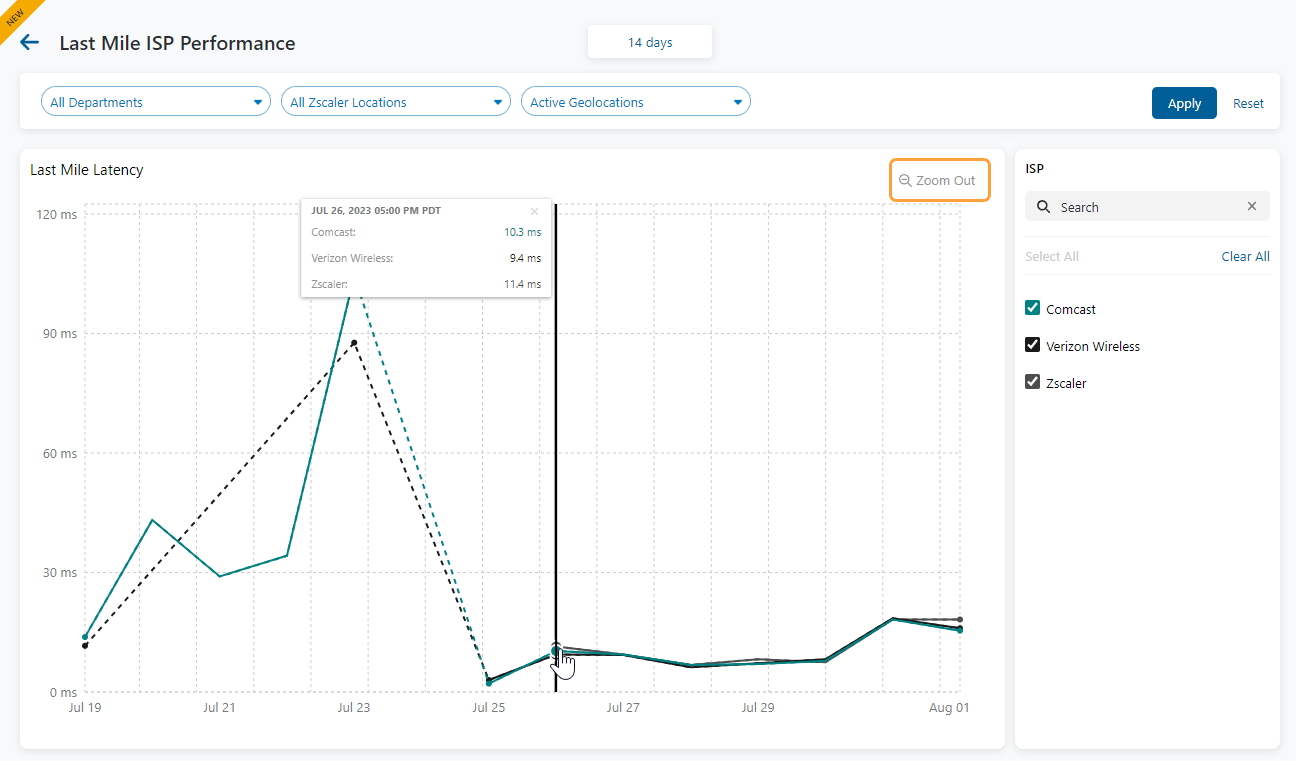
- DNS Performance
The DNS Performance report captures the average DNS latency within a 14-day time range.
Similar to other system-generated reports, you can view a more granular time range:
- Select a point in the graph. A tooltip displays the latency metrics for the selected locations.
- Drag your mouse from left-to-right to capture your time range. The graph automatically adjusts to show the latency within the new time line.
- Click Zoom Out to reset the graph back to the original view.
Up to 20 device locations are displayed at a time within the legend on the right side of the graph, based on user device information. Each location is color-coded to correspond to its trend line within the graph, with the number of devices per location included in parentheses. A minimum of one location is always displayed.
Close
- Application Performance
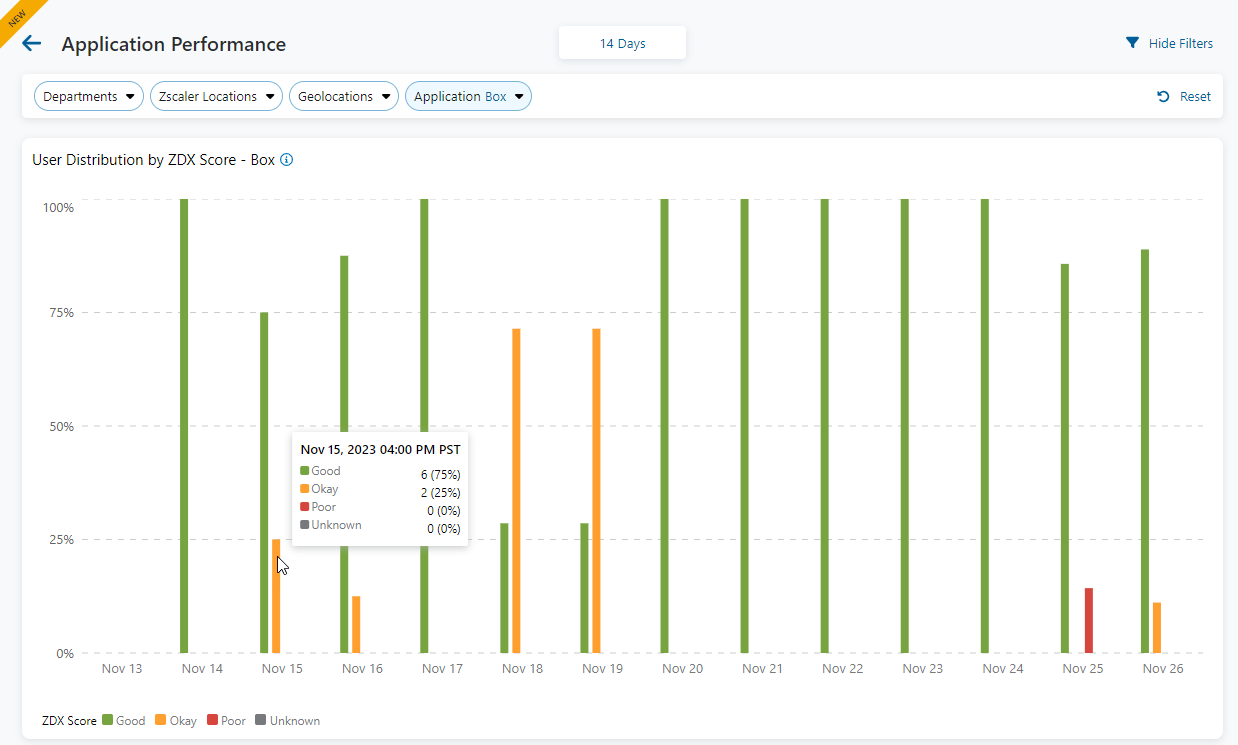
The Application Performance report captures the daily distribution of ZDX Scores within a 14-day time range.
On hover, the graph shows the count and percentage of users with a corresponding ZDX Score level for the selected application. To learn more about the range of ZDX Scores, see About the ZDX Score.
 Close
Close - ZDX Score by Application
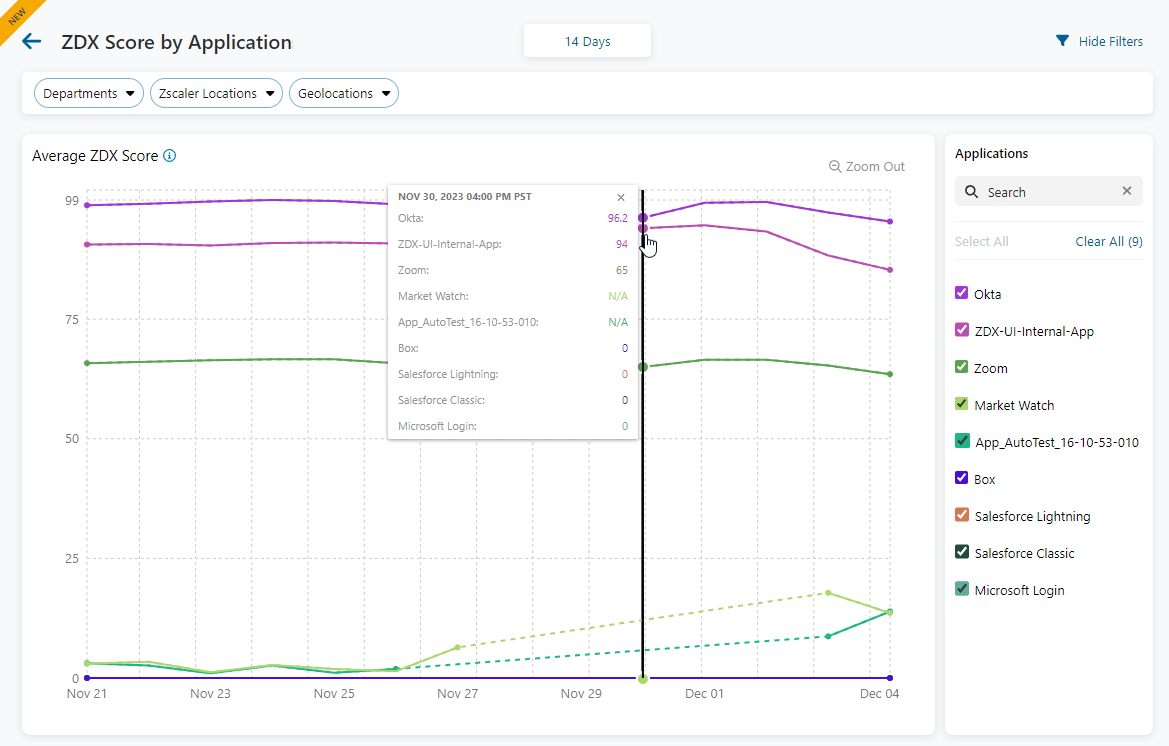
The ZDX Score by Application report captures the average ZDX Score per application within a 14-day time range.
Similar to other system-generated reports, you can view a more granular time range:
- Select a point in the graph. A tooltip displays the ZDX Scores for all active applications selected on the right-side of the graph.
- Drag your mouse from left-to-right to capture your time range. The graph automatically adjusts to show the latency within the new time line.
- Click Zoom Out to reset the graph back to the original view.
Up to 20 applications are displayed at one time on the right side of the graph, based on available applications. Each application is color-coded to correspond to its trend line within the graph. A minimum of one application is always displayed. To learn more about the range of ZDX Scores, see About the ZDX Score.
 Close
Close - Wi-Fi Distribution
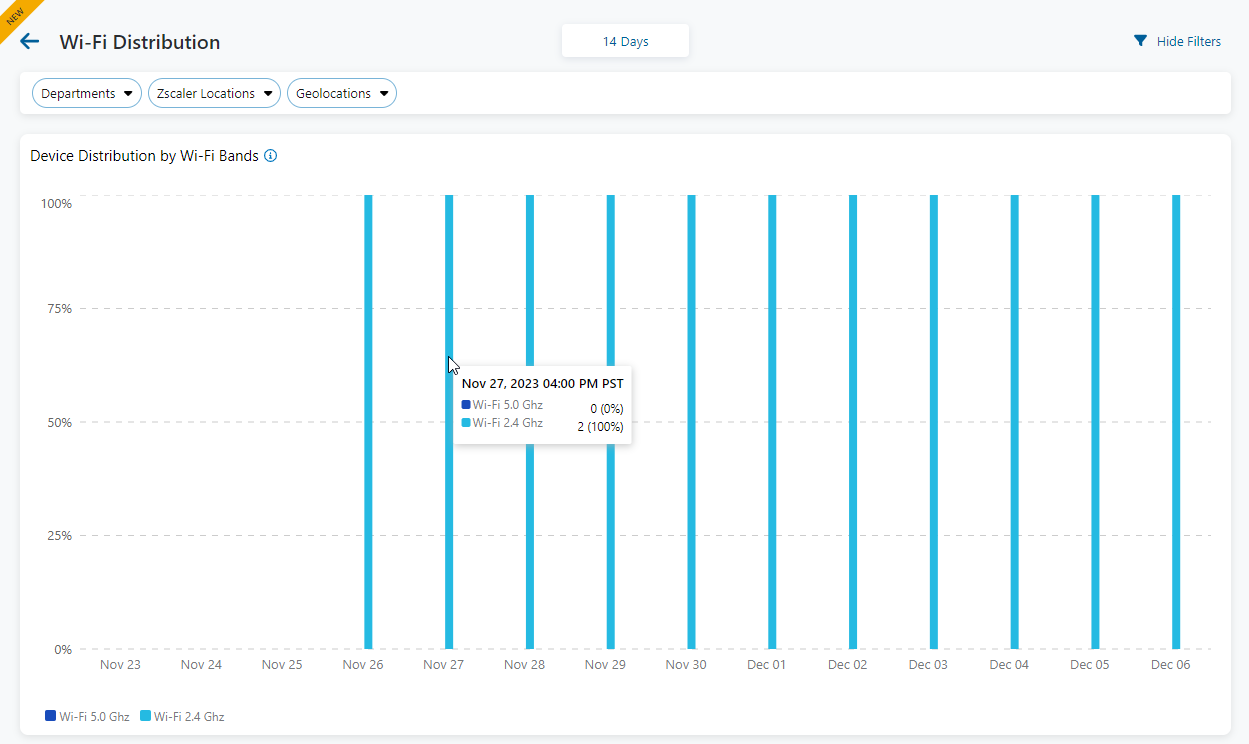
The Wi-Fi Distribution report captures the daily distribution of ZDX Scores within a 14-day time range.
On hover, the graph shows the device count per Wi-Fi band and its percentage from the total number of user devices across your organization.
 Close
Close - Active Users by Zscaler Destination
The Active Users by Zscaler Destination report captures the current distribution of active users and devices per Zscaler destination.
On hover, the graph shows the user and device counts within a 2-hour time range.
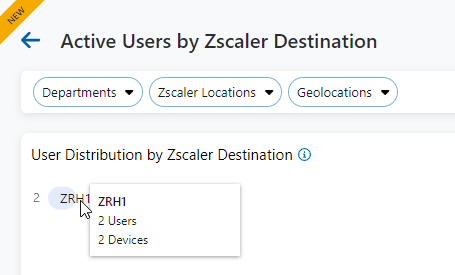
Click the icon on the far-right side of the page to view the distribution in a tabular format. You can view up to 100 destinations within the table.
 Close
Close - Top Users with Poor ZDX Scores
The Top Users with Poor ZDX Scores report captures the top 100 users within a 14-day time range who have the lowest Poor ZDX Scores, based on the selected application. The report provides the following information:
- User: Click the user to view details. To learn more, see Evaluating User Details.
- ZDX Score: The value of the user's Poor ZDX Score.
- Zscaler Location: The location as defined in Internet & SaaS. To learn more, see About Locations.
- Geolocations: The geographic area where the user is located.
- Device: The user device.
- # Probe Runs: The number of times probes were run for the selected application within the 14-day time line.
 Close
Close