Experience Center
Digital Experience Monitoring Integration on ServiceNow
With your Incident Management service user role and webhook configured, you can integrate ServiceNow with Digital Experience Monitoring to:
- Create Deep Tracing sessions to provide deeper granularity and process-level information for a user.
- Run a Root Cause Analysis to help detect and identify the root cause of a drop in an application's ZDX Score.
- Map the categories and subcategories for incoming alerts or created incidents.
Prerequisites
There are different prerequisites based on which Digital Experience Monitoring integration you are implementing. They differ between which service user role is assigned to and the required Digital Experience Monitoring information.
Assign an Incident Management Service User Role
Depending on which Digital Experience Monitoring integration your service user needs access to, you are required to have one of the Incident Management roles assigned to your service user. Optionally, you can assign both roles to a service user if they require access to Root Cause Analysis, Alerts, and Deep Tracing.
| Digital Experience Monitoring Integration | Incident Management Service User Role |
Root Cause Analysis Alerts | x_zsca2_zdx_manage.zdx_management |
| Deep Tracing | x_zsca2_zdx_manage.zdx_dt_management |
To learn more about how to assign the role, see ServiceNow Webhook Configuration Guide.
Required Digital Experience Monitoring Information for Deep Tracing and Root Cause Analysis
To start using the Digital Experience Monitoring integration for Deep Tracing or Root Cause Analysis, you must have:
- A Digital Experience Monitoring role with the correct permissions to create an API Key
- Add a Digital Experience Monitoring Role with the following permissions to create an API Key:
- Dashboard Access: View Only
- Diagnostics: Full
- Device and User Information: Visible
- Assign the role to an existing Digital Experience Monitoring admin or by adding a Digital Experience Monitoring admin. See Assigning Admins to Zscaler Service and Adding Users.
- Create an API Key on the API Key Management page.
- Save the API Key ID and Secret for the ServiceNow Settings Module.
- Add a Digital Experience Monitoring Role with the following permissions to create an API Key:
- An Admin Portal URL
Your Admin Portal URL is where you run Deep Tracing Sessions and Root Cause Analysis.
The format must be:
Close[subdomain].[second-level-domain].[top-level-domain](e.g.,admin.zdxcloud.net). - A Digital Experience Monitoring Public API URL
Your Digital Experience Monitoring Public API URL is where the public API has access.
The format must be:
Close[subdomain].[second-level-domain].[top-level-domain](e.g.,api.zdxcloud.net).
Configuring the Settings Module on ServiceNow for Digital Experience Monitoring Integration
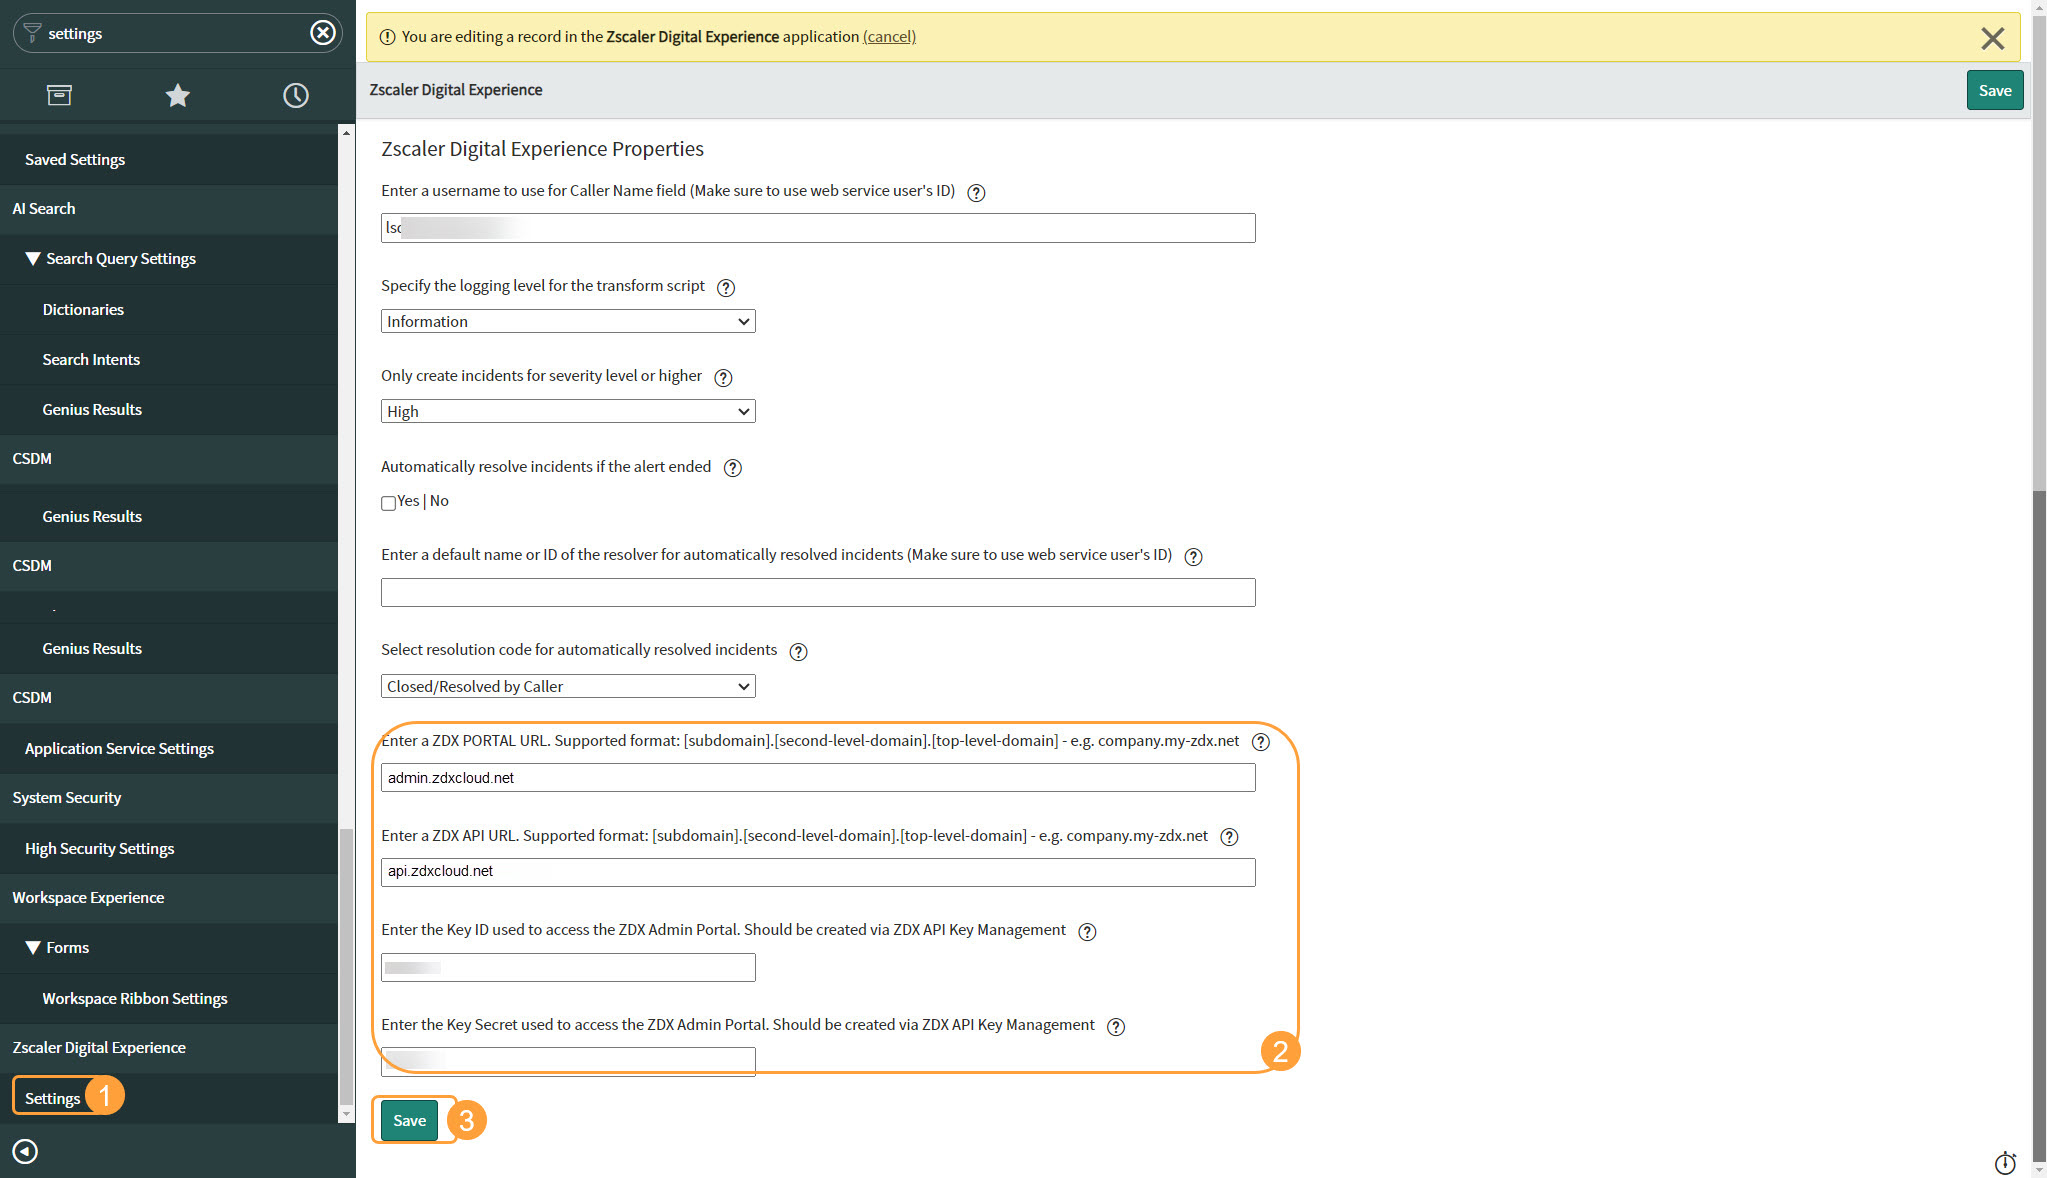
You must configure the Zscaler Digital Experience application fields to enable Deep Tracing and Root Cause Analysis.
To configure the Settings Module on ServiceNow for Digital Experience Monitoring integration:
- Go to the Settings module of your Zscaler Digital Experience application on ServiceNow.
- In the Settings module:
- ZDX Portal URL: Enter your Admin Portal URL.
- ZDX Public API URL: Enter your Digital Experience Monitoring Public API URL.
- Key ID: Enter your Key ID from your Digital Experience Monitoring API Key.
- Key Secret: Enter your Key Secret from your Digital Experience Monitoring API Key.
- Click Save.
Deep Tracing Integration on ServiceNow
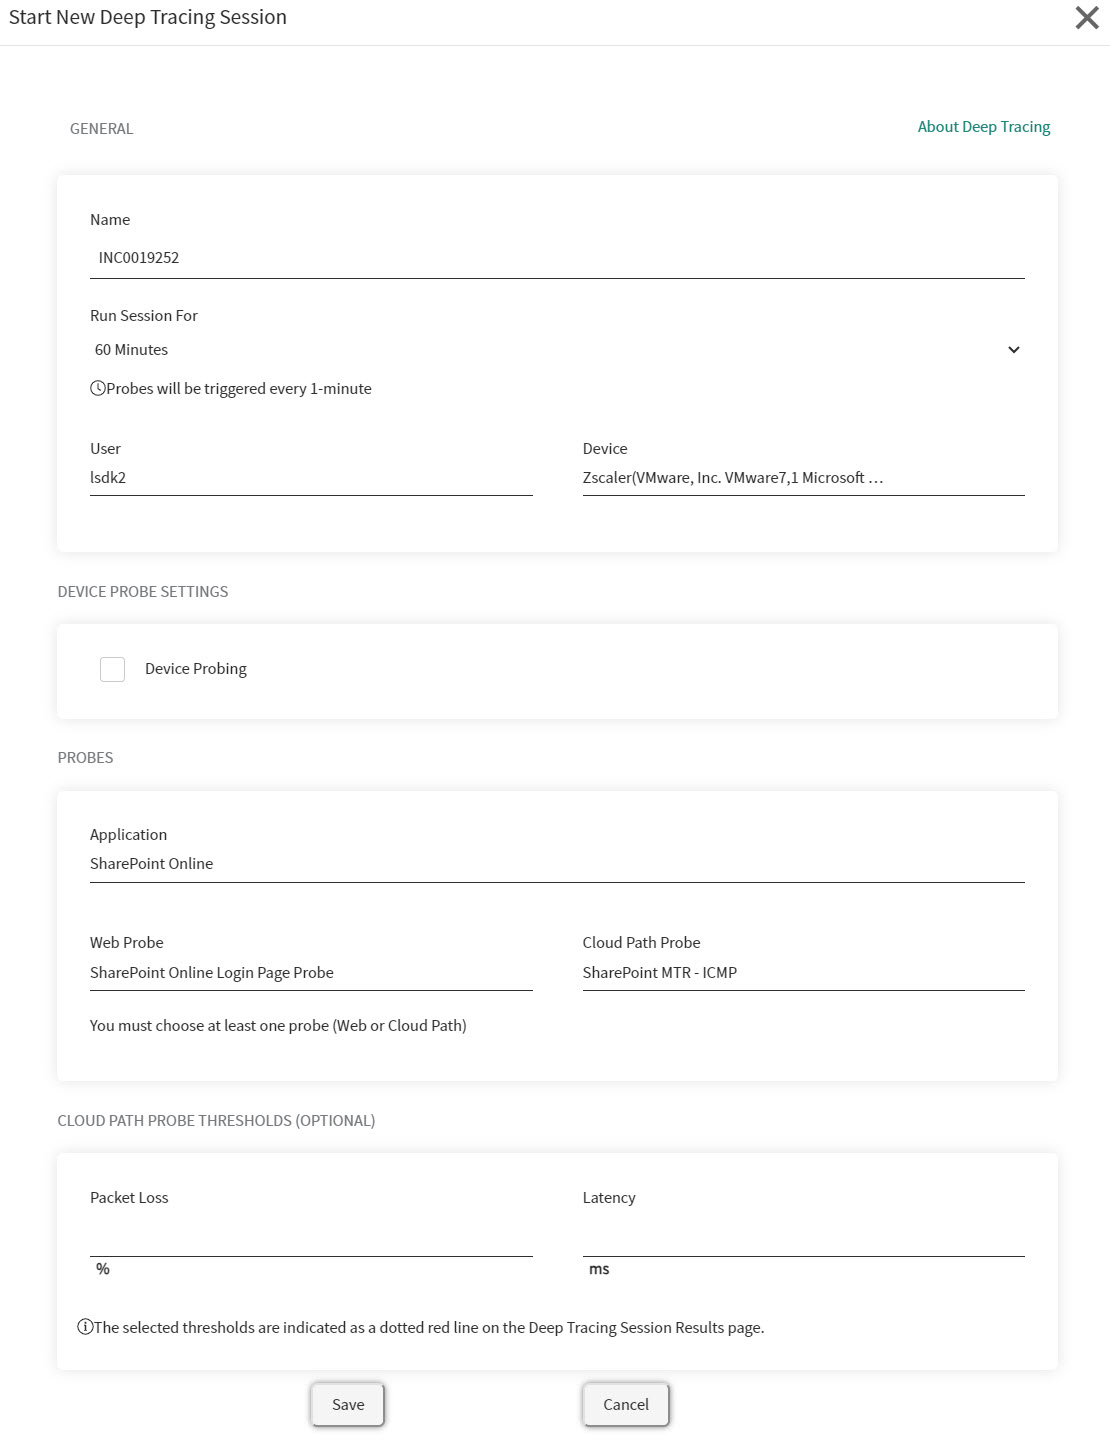
To start a new Deep Tracing session on the Incident Management of your ServiceNow console:
- Select the incident assigned to you based on your user's Caller name.
- Click the Deep Tracing button.
- On the Deep Tracing page:
- Name: Enter the name of the Deep Tracing session. This includes the current incident number by default.
- Run Session For: Select the duration of the Deep Tracing session. You can select from 5 minutes, 15 minutes, 30 minutes, or 60 minutes.
- User: Select the impacted user.
- Device: Select the impacted user's device.
- Device Probing: Enable to gather device data for Deep Tracing.
- Application: Select the impacted application.
- Web Probe: Select the application's Web probe.
- Cloud Path Probe: Select the application's Cloud Path probe to configure the Cloud Path Probe Thresholds.
- (Optional) Cloud Path Probe Thresholds: Enter the following information.
- Packet Loss (%): Enter a percentage of packet loss for Deep Tracing.
- Latency (ms): Enter the latency to measure for Deep Tracing.
- Click Save.
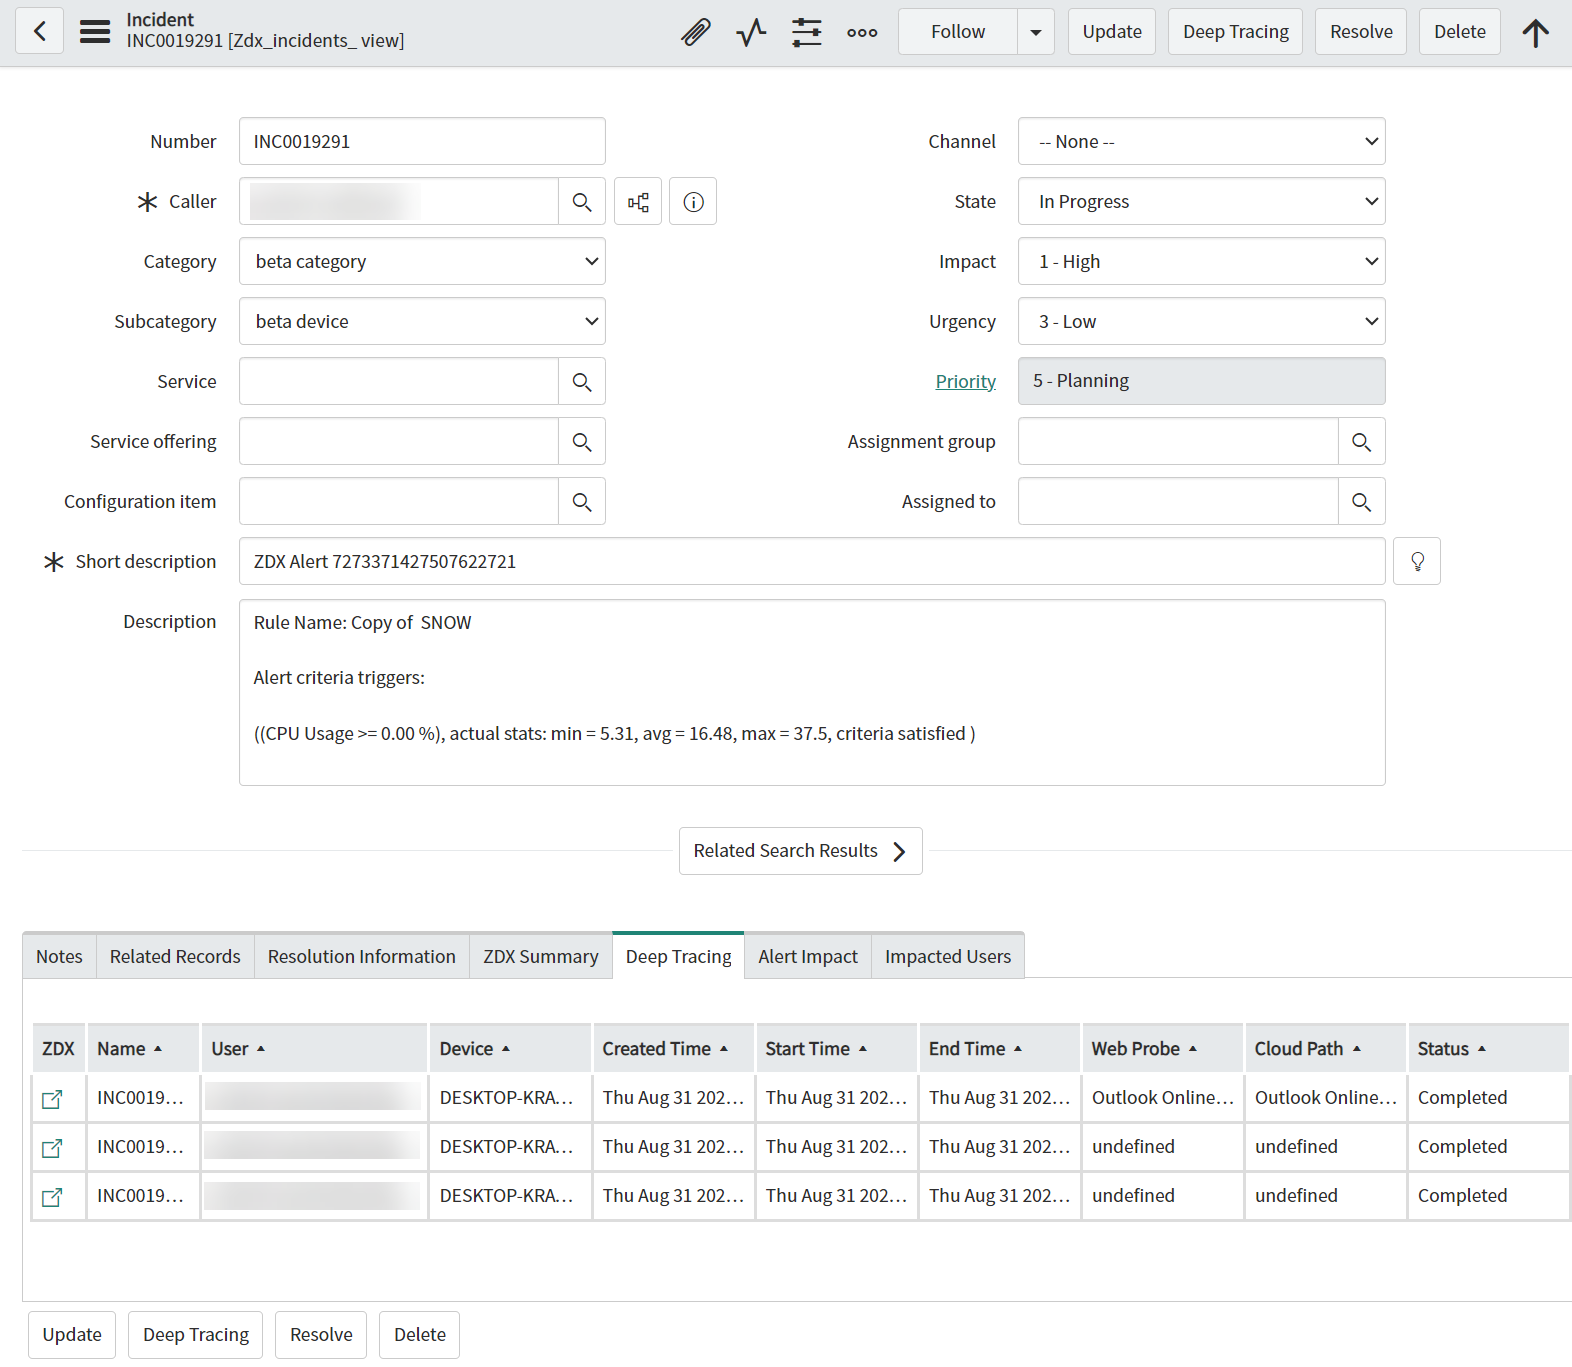
After completing a Deep Tracing session, you can view a list of Deep Tracing sessions in the Incident's Deep Tracing section with the following information:
- ZDX Link: A link to the Deep Tracing session in the Admin Portal.
- Name: The name of the Deep Tracing session on the Admin Portal.
- User: The impacted user.
- Device: The impacted user's device.
- Created Time: The time the session was created by the Digital Experience Monitoring admin.
- Start Time: The time that the Zscaler Client Connector accepted the request and started collecting data.
- End Time: The time the session ended.
- Web Probe: The application's Web probe that is monitored for the session.
- Cloud Path: The application's Cloud Path probe that is monitored for the session.
- Status: The current session status differs depending on the table in which the session is listed. To learn more, see Understanding the Deep Tracing Session Status.
Root Cause Analysis Integration on ServiceNow
To run a Root Cause Analysis on the Incident Management of your ServiceNow console:
- Select the incident assigned to you based on your user's Caller name.
- Click the ZDX Summary tab.
- On the ZDX Summary page:
- From: Select when the Root Cause Analysis starts.
- To: Select when the Root Cause Analysis stops.
- Click Submit.
Under the Application section, click Analyze Score on one of the existing applications. A progress bar for the Root Cause Analysis appears.
When the Root Cause Analysis is completed, you can view a list of factors that determine the ZDX Score.
Mapping the Digital Experience Monitoring Alert Types to ServiceNow Categories and Subcategories
To map the Digital Experience Monitoring Alert types to ServiceNow Categories and Subcategories:
- Open an existing ServiceNow instance.
- In the Global Application scope, enter
sys_choice.listin the Filter Navigator type. - Click New.
- Configure the following properties to create a new record:
- Table: Select Incident.
- Element: Enter category or subcategory.
- Label: Enter the name of the label (e.g.,
ZDX Alert Category). - Value: Enter the code to access this record (e.g.,
zdx_alert_category). - Dependent Value: If you are creating a subcategory, enter the value of the root category as required.
- Click Submit.
You can now view the Alert Impact and Impacted Users pages. You can also configure the Mappings module. To learn more, see Understanding the Zscaler Digital Experience Application Fields on ServiceNow.
Alert Impact
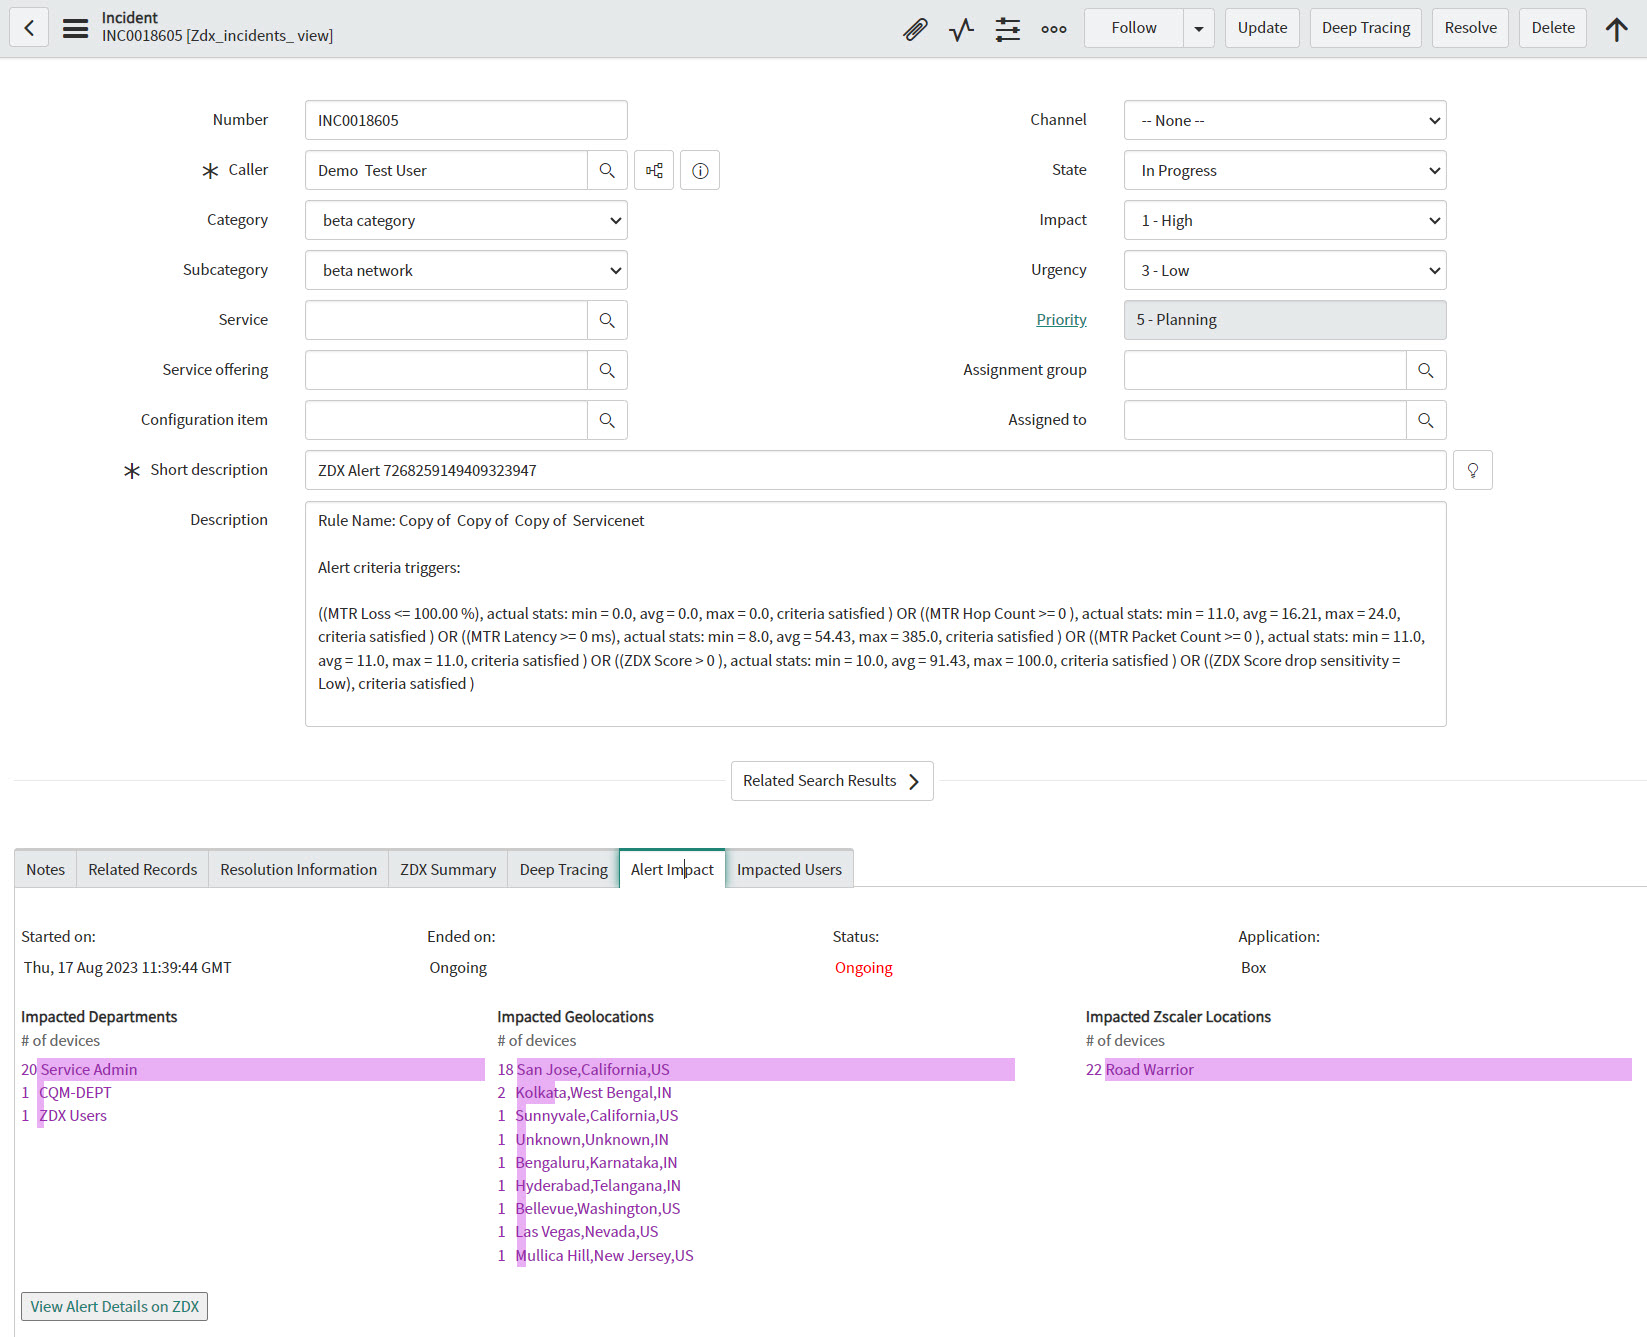
The Alert Impact page provides an overview of the impacted devices that meet the alert rule's criteria. The impacted devices are sorted based on Departments, Geolocations, and Zscaler Locations.
To access Alert Impact:
- Select an Incident.
- Click Alert Impact.
You will not get results for Alert Impact or Impacted Users if the ZDX Score is an alert type, as the public API for alerts does not support it.
Impacted Users
The Impacted Users page displays a list of impacted devices and their users that meet the alert rule's criteria. The maximum number of devices displayed is 100.
You can view:
- Device: The device name.
- User Name: The user's name.
- User Email: The user's email.
- Link: A link to the impacted device page in the Admin Portal.
You will not get results for Alert Impact or Impacted Users if the ZDX Score is an alert type, as the public API for alerts does not support it.


