Experience Center
Viewing Process Inventory
Process Inventory allows you to monitor processes that might be impacting the behavior of your users' devices. Process calculations are updated in one-minute rolling intervals, and the top processes are displayed every five minutes.
Prerequisites
To view the processes, ensure:
- You're running the minimum required versions of Zscaler Client Connector and ZDX Module.
- Your Digital Experience Monitoring subscription level supports Process Inventory. To learn more, see Ranges & Limitations.
- You've set a CPU usage threshold for devices in your organization. To learn more, see Configuring Inventory Settings.
Viewing the Process Overview
To access the Process Overview page, go to Analytics > Digital Experience Management > Inventory > Process Overview. Use the time range filter and page filters to help narrow the scope of CPU incidents based on your CPU usage threshold setting:
- Device Vendors: The names of supported device vendors.
- Departments: The names of your organization's departments.
- Zscaler Locations: The list of locations where a user accessed a device, as defined in Zscaler Internet & SaaS. To learn more, see About Locations.
- Geolocations: The geographic areas where users accessed their devices.
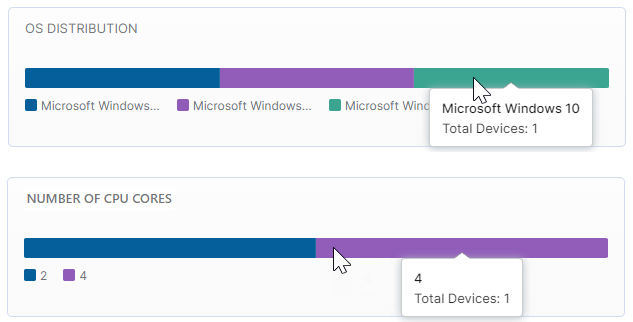
Hover over the bar charts to view the OS distribution and CPU cores for devices:
- OS Distribution: The number of devices per operating system across your organization.
- Number of CPU Cores: The number of CPU cores with associated devices in your organization.
Viewing Top Processes By Incidents
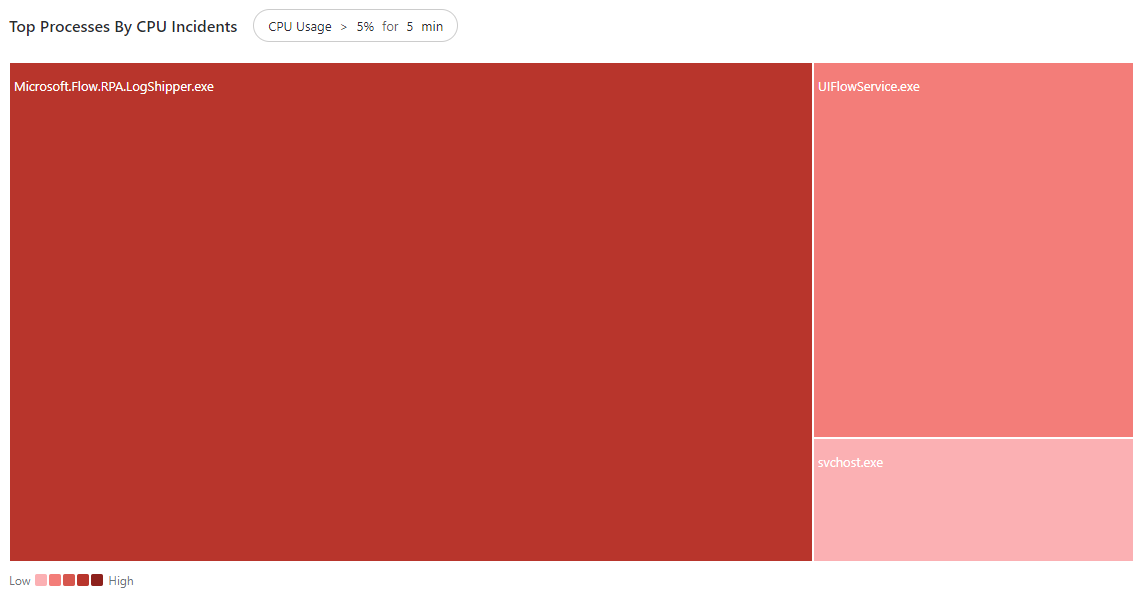
View the top processes for CPU usage incidents based on the threshold percentage you've defined in Configuring Inventory Settings. These processes have exceeded the threshold within a 5-minute interval, and are color-coded according to number of incidents, as indicated in the legend. The darker the color, the more incidents that have occurred. The size of each tile visually indicates the number of impacted devices relative to other tiles. For example, the following image shows that Microsoft.Flow.RPA.LogShipper.exe has more incidents that have exceeded the CPU usage threshold than other processes.
To view details about a specific process:
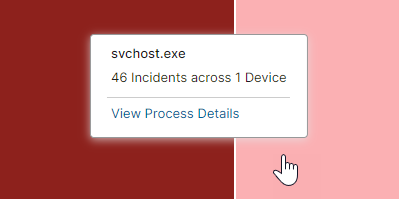
- Hover over a process tile. A tooltip displays the total number of incidents impacting the number of devices for that process.
- Select the tile or click View Process Details.
Viewing Process Inventory
To access the Process Inventory page, go to Analytics > Digital Experience Management > Inventory > Process Inventory. Use the time range filter and page filters to help narrow your scope for the top processes based on your threshold setting to trigger CPU incidents. The page provides a current snapshot of CPU usage that has exceeded the threshold on user devices. The table on the Process Inventory page provides the following information:
- Name: The name of the process.
- Devices: The number of devices impacted.
- CPU Incidents: The number of incidents that have exceeded your configured CPU threshold.
- Avg Memory: The average percentage of RAM used for the process.
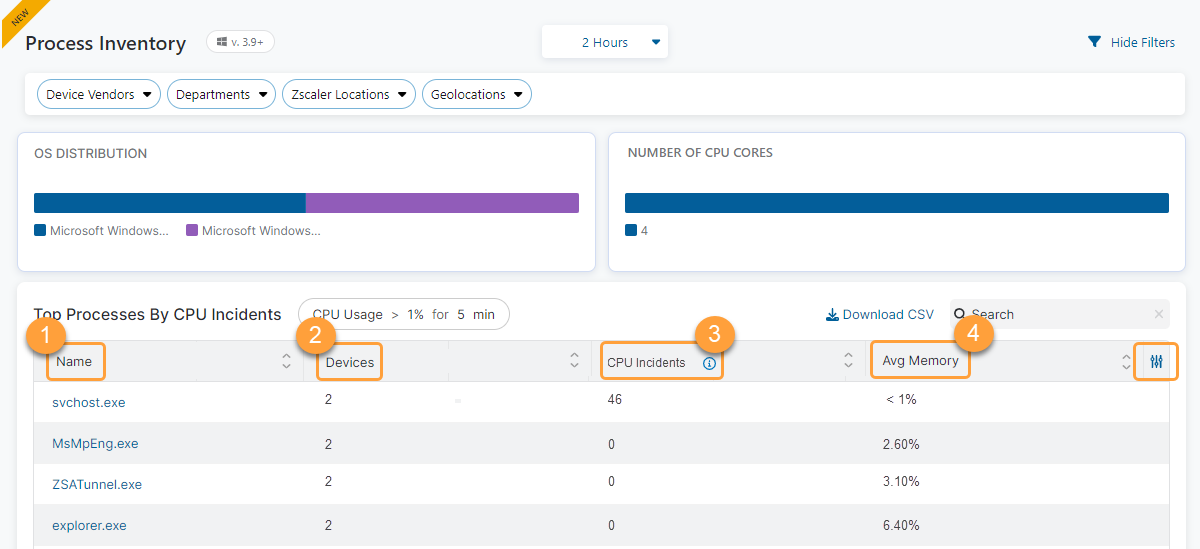
You can click the Modify Table icon to select, deselect, or rearrange the table columns. To view details about a specific process, select a process name within the table. The details page for that process is displayed.
Viewing Process Details
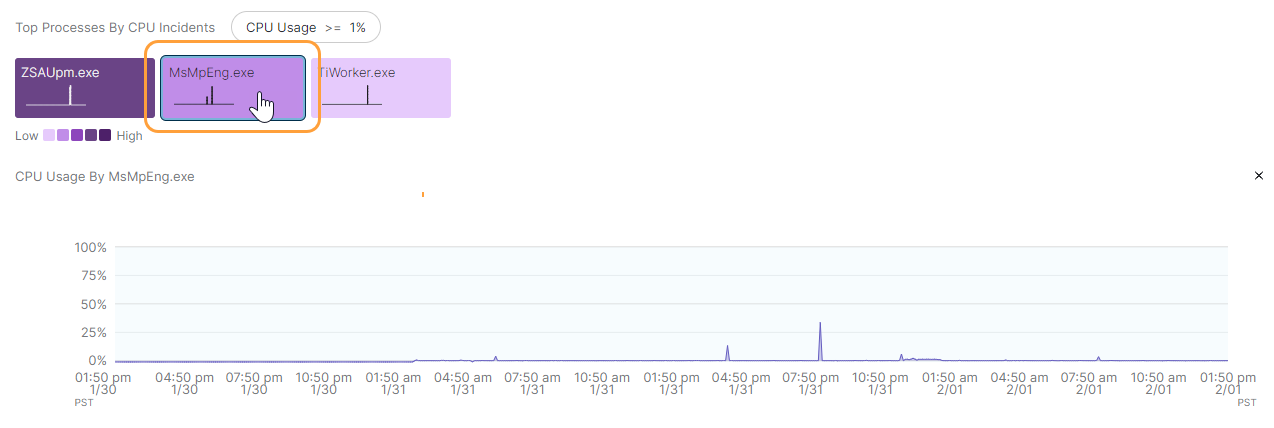
The process details page provides a graph that shows the CPU usage percentage in conjunction with the number of associated user devices. CPU usage is indicated by the shading of color based on the percentages shown in the graph legend.

The process details table provides the following information per device:
- Device: The user's device type.
- User: The name of the device user.
- CPU Incidents: The number of incidents that have exceeded your configured CPU threshold.
- Avg Memory: The average percentage of RAM used for the process.
- Disk Read: The number of bytes read from the disk.
- Disk Write: The number of bytes written from the disk.
- Network Upload: The number of bytes uploaded by the device.
- OS: The operating system running on the device.
- Device Vendor: The device vendor's name.
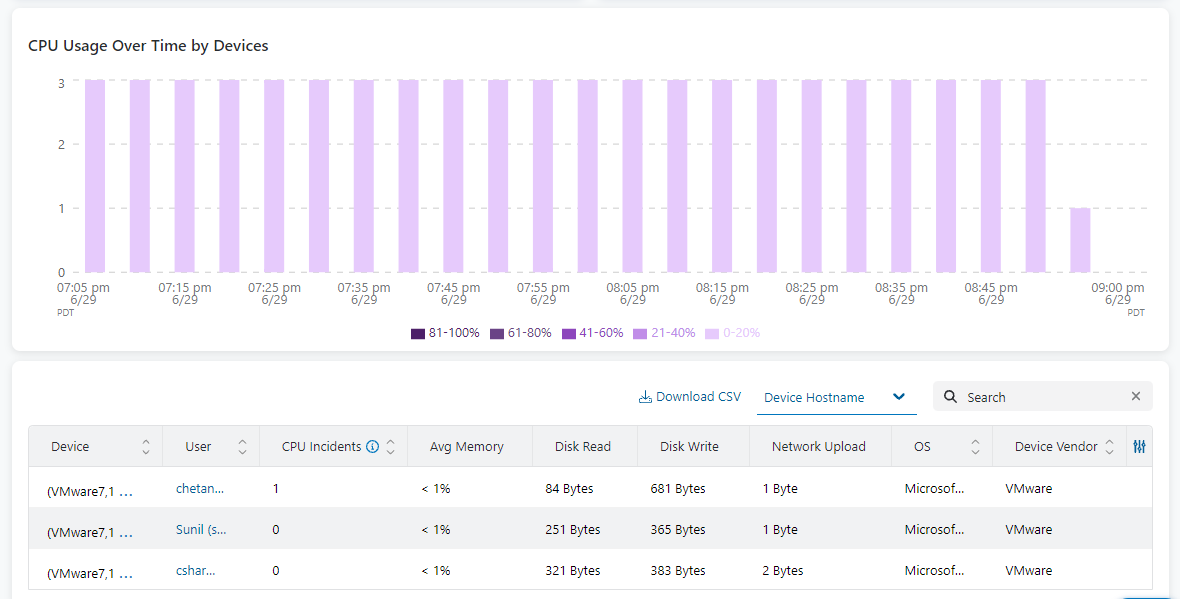
To view details about the device user and device performance, select the user name in the table.
Viewing User Details
By default, the user details page provides Probe Analytics to display web metrics and the Cloud Path graphs for the selected application:

Click Device Performance to view Device Health metrics for the selected device. If more than one process is shown for the device, you can select a process to view its percentage of CPU usage within your set time range.
