Experience Center
Configuring Data Explorer Views
Data Explorer provides the flexibility to build and organize your own customized views of applications and metrics to analyze data. To learn more about monitoring Data Explorer views, see Monitoring Data Explorer Views.
Prerequisites
Before configuring a view in Data Explorer, make sure your Digital Experience Monitoring subscription level supports Data Explorer. To learn more, see Ranges & Limitations.
Creating a View
You have the option to create a view from either End User or Hosted Monitoring data. To learn more about Hosted Monitoring, see Understanding Zscaler Hosted Monitoring.
To begin creating your view:
- Go to Analytics > Digital Experience Management > Reporting > Data Explorer.
Click Create New View.
Create a View for End User Monitoring
To create a view for End User Monitoring:
- On the Untitled View page, select End User Monitoring from the Data Source drop-down menu.
- Use the time range filter and the page filter options to narrow the results of your view. Some filters are unavailable if your selected time range is greater than 48 hours. Your time range also determines the granularity of the data displayed in the charts:
- If 24 Hours or less, data is displayed in 5-minute intervals.
- If greater than 24 Hours but less than (or equal to) 14 Days, data is displayed in 1-hour intervals.
- Structure your view:
- a. Applications
Click Add to specify the applications for your view:
- If you select a UCaaS (Call Quality) application, you can add other UCaaS applications for your view.
- If you select a non-UCaaS application, you can add other non-UCaaS applications for your view.
The applications you select determine the particular metrics that are available. The number of applications you can add depends on your Digital Experience Monitoring subscription level. To learn more, see Ranges & Limitations.
Close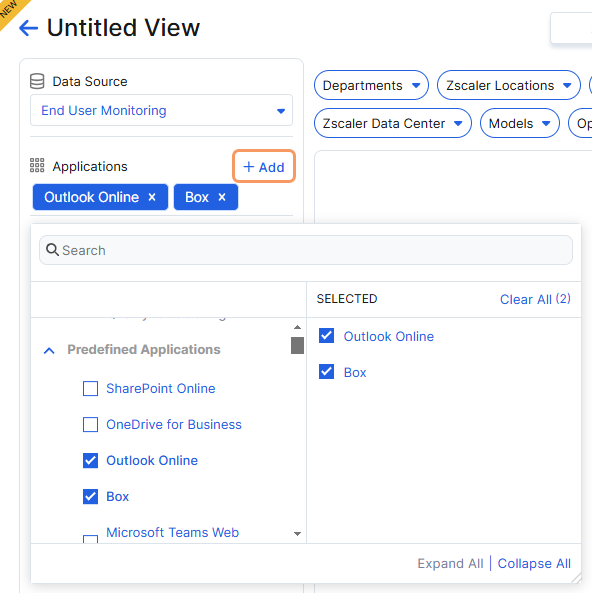
- b. Metrics
Click Add to specify the metrics for your view. The number of metrics you can add depends on your Digital Experience Monitoring subscription level. To learn more, see Ranges & Limitations.
Close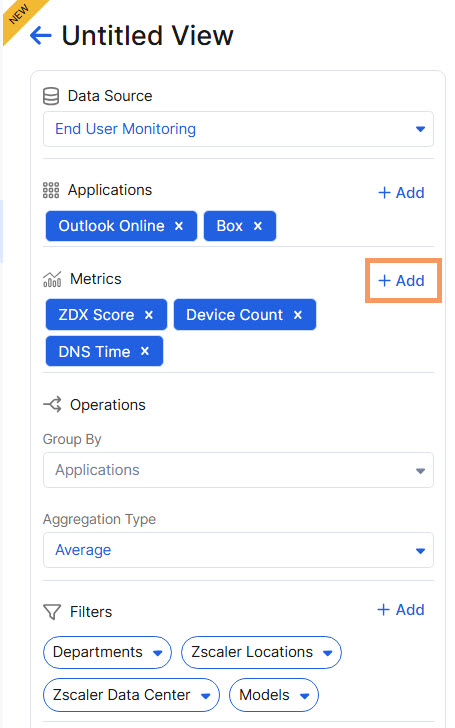
- c. Group By
Select an option to group data by Zscaler Locations, Geolocations, Departments, Applications, Last Mile ISPs, or Zscaler Data Center. If you group by Applications, views are rendered for each metric. If you group by other options in the drop-down menu, views are rendered for each application and metric.
If you've selected more than one application for your view, your Group By option is limited to Applications.
Close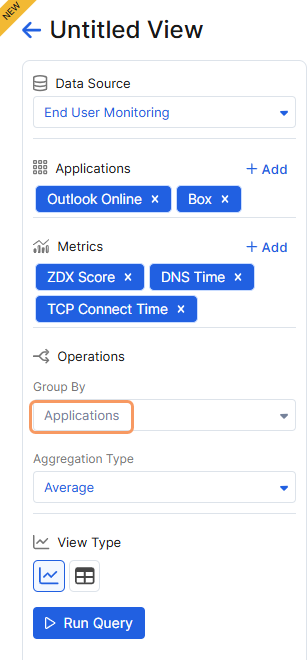
- d. Aggregation Type
Select the Average, Minimum, or Maximum method for data aggregation across all users. The default setting is Average.
Close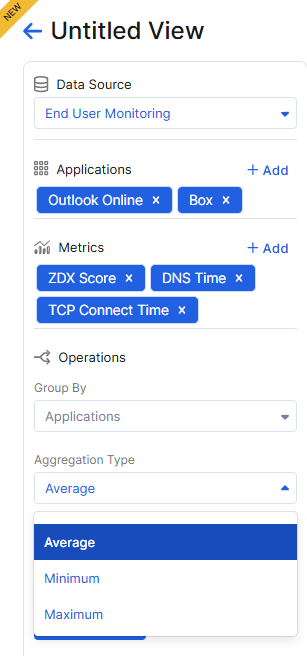
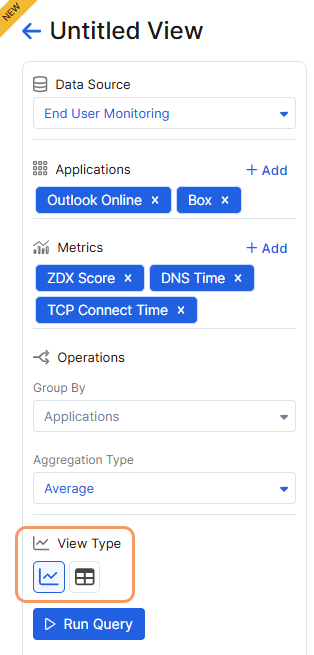
- e. View Type
- a. Applications
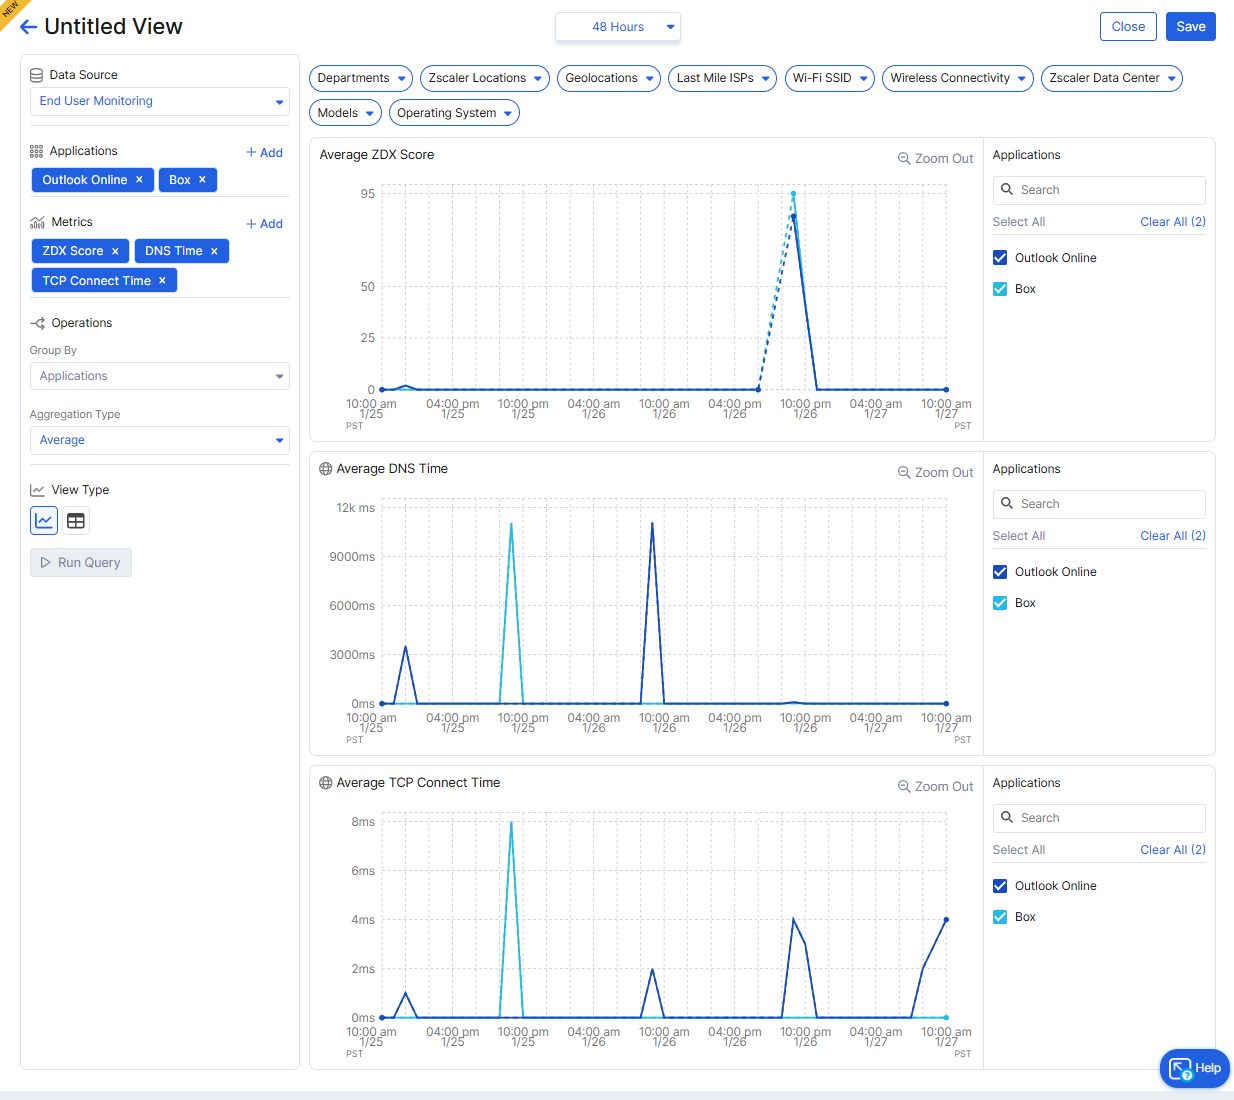
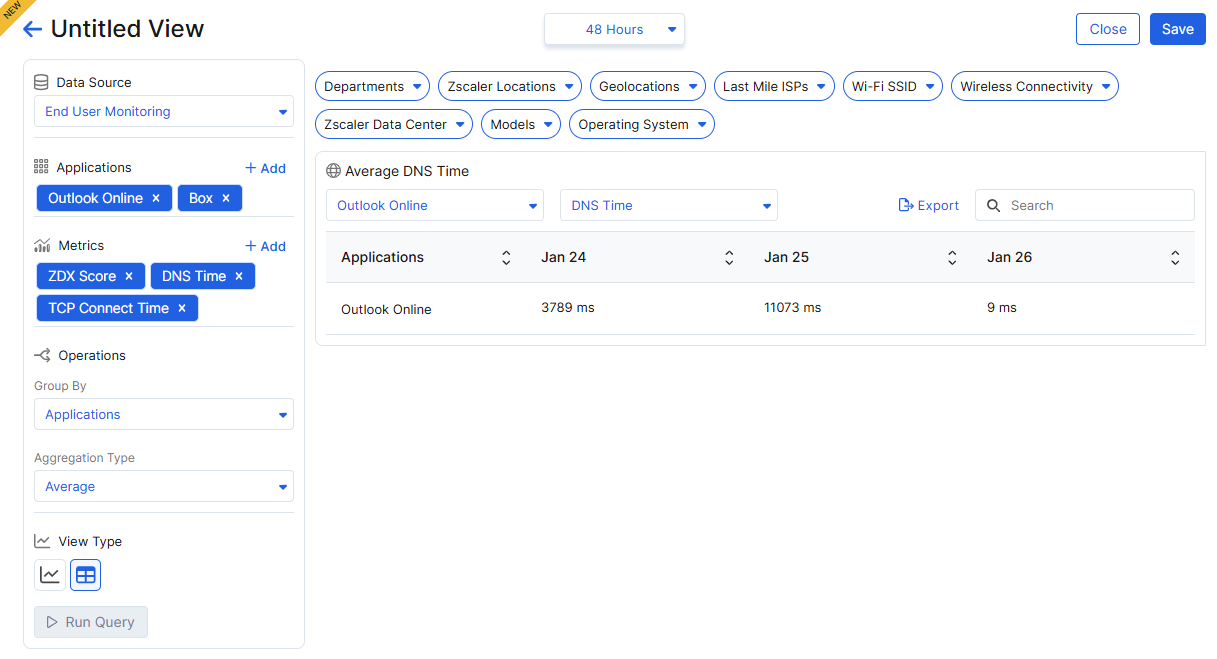
- Click Run Query to display your view.
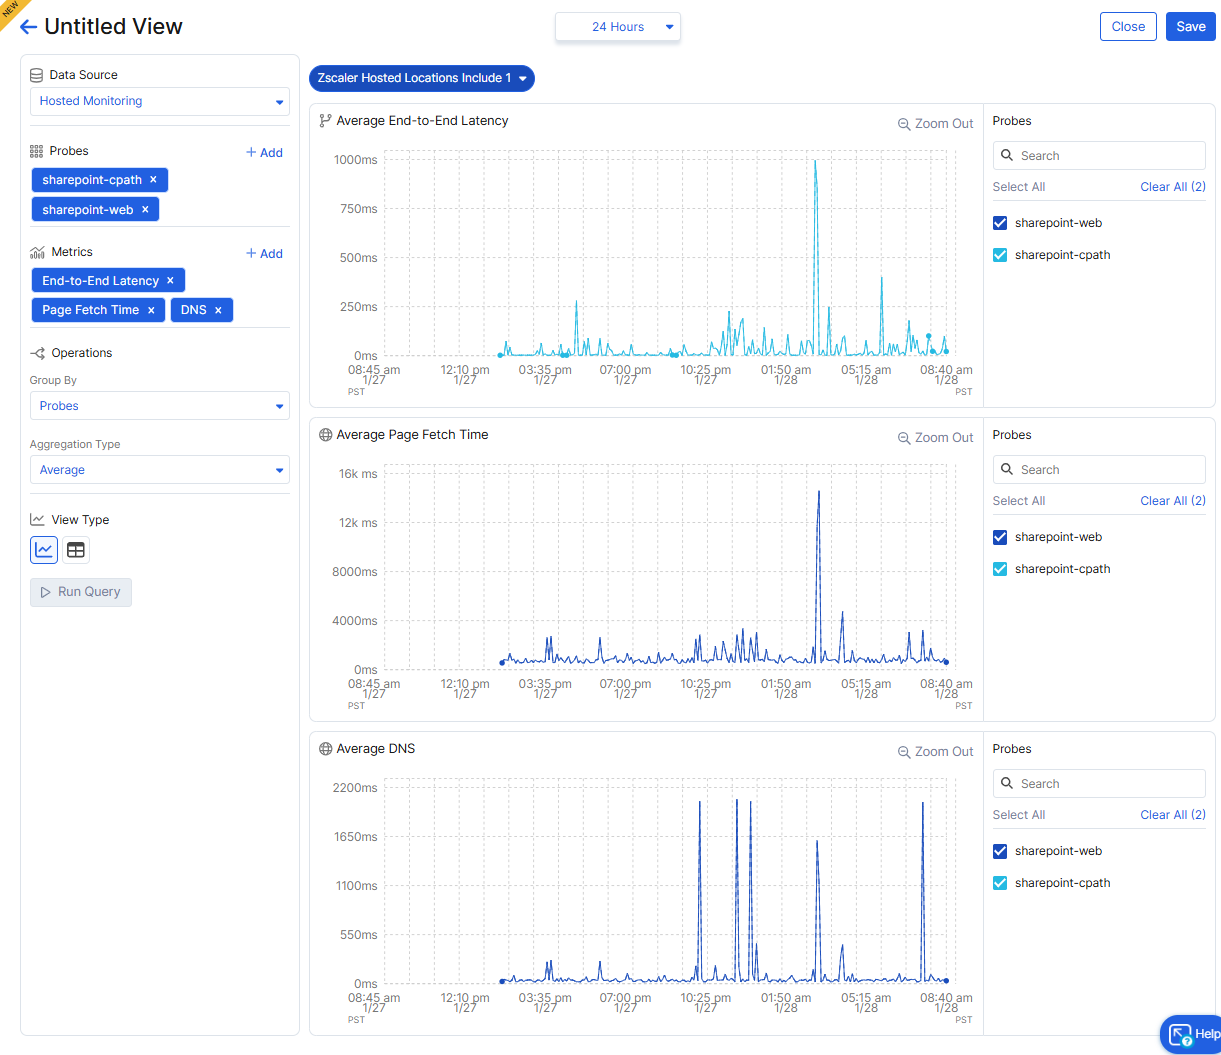
The chart format displays individual charts for your selected applications and metrics. For details about the interaction and format of Data Explorer charts, see Viewing System-Generated Reports.
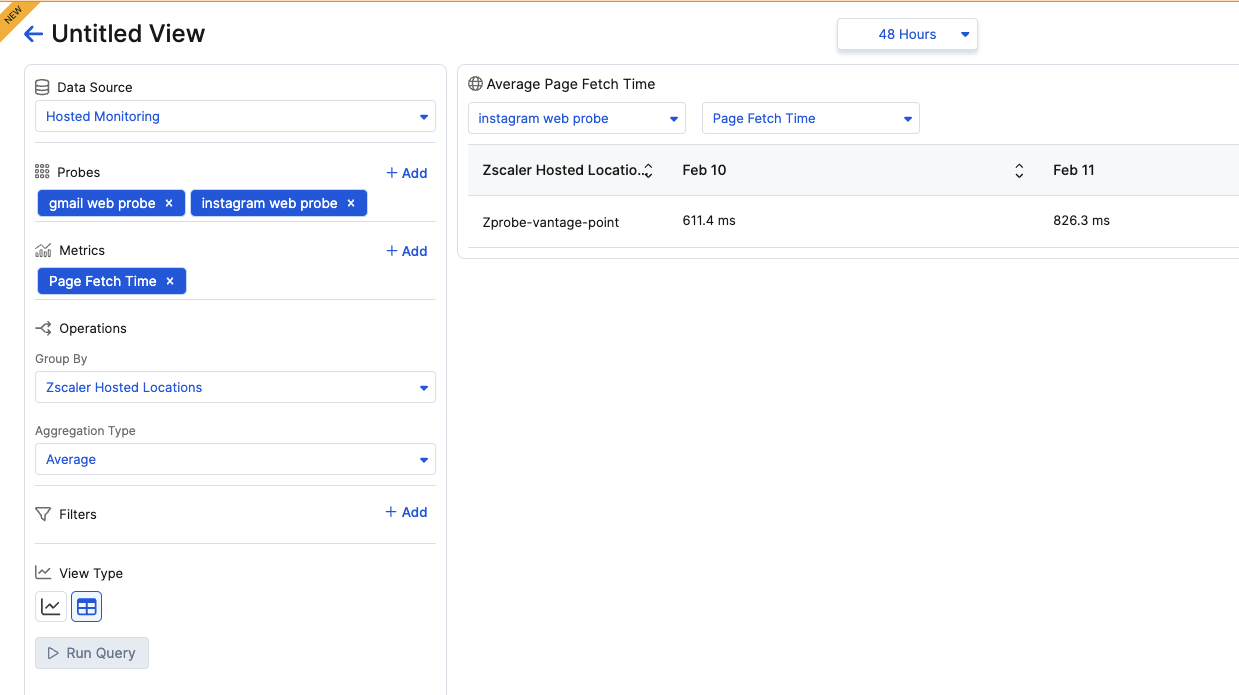
The tabular format provides the flexibility to filter your selected applications and metrics for an instant view of the data. To capture your configured table information in a CSV file, click Export, then click the Download icon.
- Click Save to keep your view for future access. To learn more, see Monitoring Data Explorer Views.
- Enter a name for your view in the dialog window, and click Save to save your configuration.
The total number of views you can save depends on your Digital Experience Monitoring subscription level. To learn more, see Ranges & Limitations.
Create a View for Hosted Monitoring
To create a view for Hosted Monitoring:
- On the Untitled View page, select Hosted Monitoring from the Data Source drop-down menu.
- Use the time range filter to narrow the results of your view. The default time range is 24 hours. Your time range also determines the granularity of the data displayed in your views.
- Use the Zscaler Hosted Locations filter to select the Zscaler data centers to run your probes.
- Structure your view:
- a. Probes
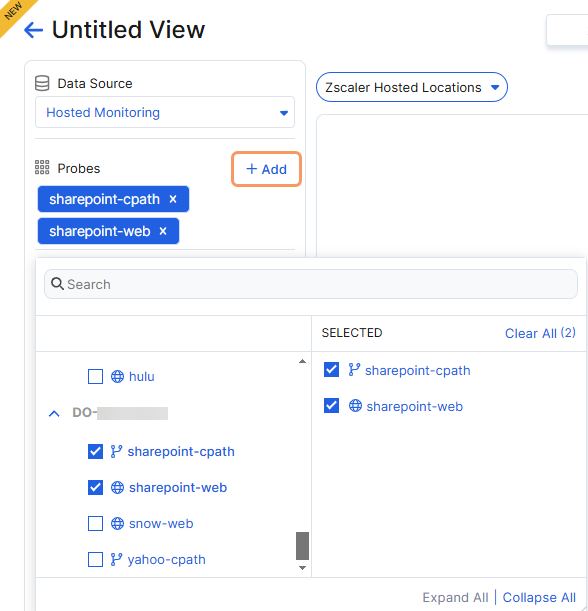
Click Add to specify the probes for your view. You can add up to 10 probes for Hosted Monitoring.
 Close
Close - b. Metrics
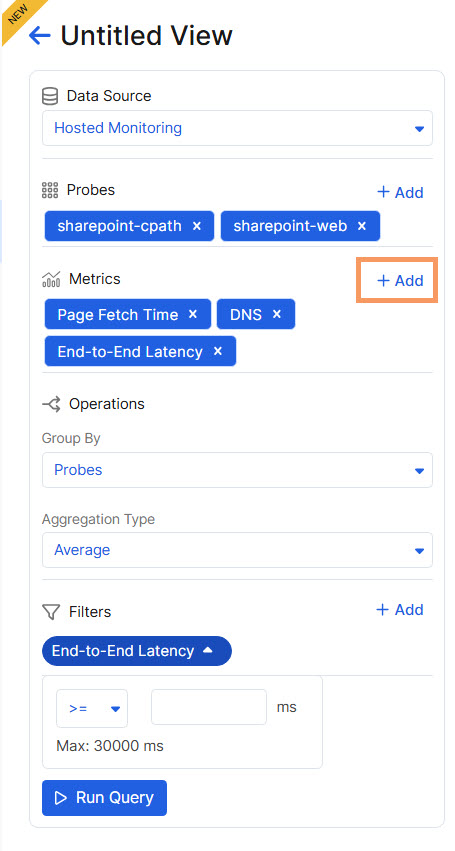
Click Add to specify the metrics for your view. You can add up to 10 metrics for Hosted Monitoring.
 Close
Close - c. Group By
Select the option to group data by Probes or Zscaler Hosted Locations.
If you've selected more than one metric for your view in chart format, your Group By option is limited to Probes.
Close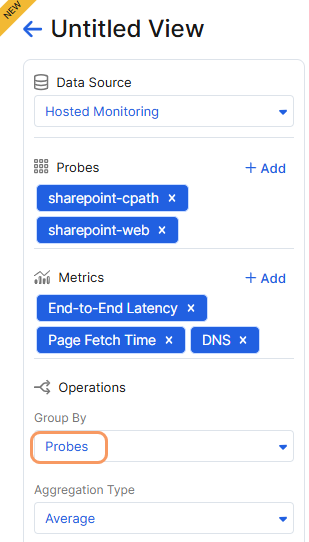
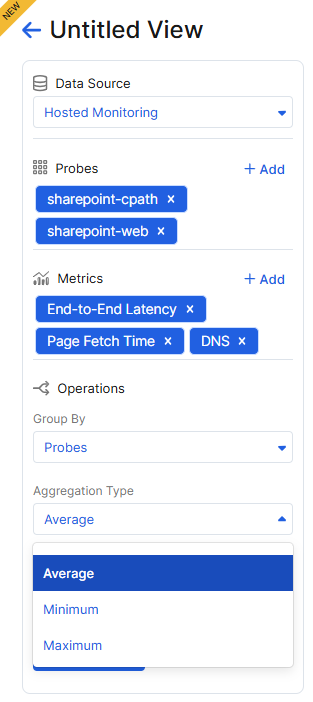
- d. Aggregation Type
Select the Average, Minimum, or Maximum method for data aggregation across all users. The default setting is Average.
 Close
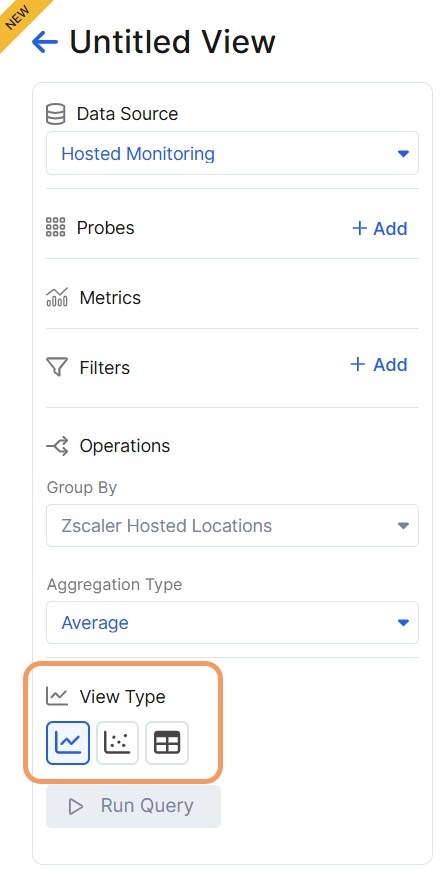
Close - e. View Type
- a. Probes
- Click Run Query to display your customized view:
The chart format displays individual charts for your selected applications and metrics. For details about the interaction and format of Data Explorer charts, see Viewing System-Generated Reports.
The tabular format provides the flexibility to filter your selected applications and metrics for an instant view of the data. Only the top 1,000 rows are displayed. To capture your configured table information in a CSV file, click Export, then click the Download icon.
- Click Save to keep your view for future access. To learn more, see Monitoring Data Explorer Views.
- Enter a name for your view in the dialog window, and click Save to save your configuration.
The total number of views you can save depends on your Digital Experience Monitoring subscription level. To learn more, see Ranges & Limitations.
Editing a View
Only the Digital Experience Monitoring Super Admin or the admin who created the view can edit a configured Data Explorer view.
To edit a Data Explorer view:
- Go to Analytics > Digital Experience Management > Reporting > Data Explorer.
- Search for the view you want to edit in the Data Explorer table.
- Click the Edit icon for the view.
- After you've finished editing, click Run Query to display your edited view.
- Click Update.
- Activate your changes.
Deleting a View
Only the Digital Experience Monitoring Super Admin or the admin who created the view can delete a configured Data Explorer view.
To delete a Data Explorer view:
- Go to Analytics > Digital Experience Management > Reporting > Data Explorer.
- Search for the view you want to delete in the Data Explorer table.
- Click the Delete icon for the view.
- In the dialog window, confirm you want to delete the view.
- Activate your change.

