Experience Center
Viewing the Sandbox Threats Dashboard
The Sandbox Threats dashboard provides an overview of Sandbox policy actions taken for known and unknown files in your organization. Known files are files that the Sandbox analyzed and classified as malicious or benign. Unknown files are files that the Sandbox encounters for the first time.
Filtering
- Time Range: Use the Time Range filter in the upper right to choose a specific time range between 1 Day and 90 Days in which to view data. The selected period applies to all data within the dashboard. The default time range is 14 Days.
- Status: Select the result of the policy action: Allowed or Blocked.
Dashboard Widgets
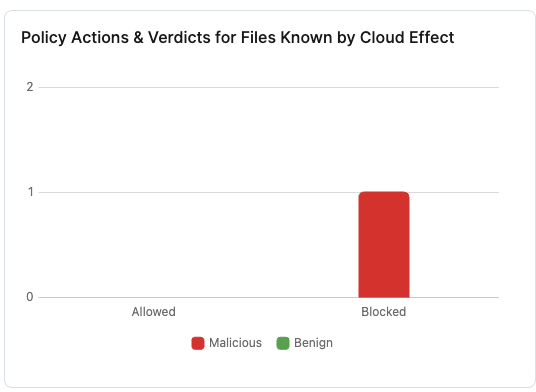
- Policy Actions & Verdicts for Known Files
This bar chart shows the number of benign or malicious files allowed or blocked for the selected time range.
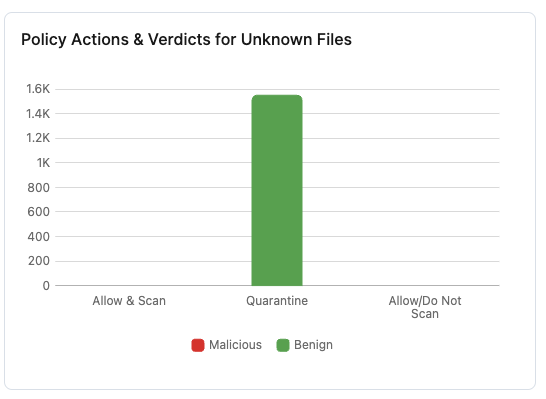
Close - Policy Actions & Verdicts for Unknown Files
This bar chart shows the number of files that were identified as benign or malicious after being sent for Sandbox analysis, categorized into three categories: Allow & Scan, Quarantine, and Allow/Do Not Scan.
A situation might occur where a file that has been quarantined could also be counted under Allow & Scan if the file was allowed while in quarantine. For example, user A has a quarantine Sandbox rule applied to them, and user B has an allow and scan rule applied to them. User A attempts to download an unknown file that is sent for Sandbox analysis because of the quarantine rule. While the unknown file is being analyzed, user B can download the same file because of the allow and scan rule. In this case, the file would be counted under Quarantine and Allow & Scan.
Malicious files downloaded due to the Allow & Scan policy action are patient 0 events. Zscaler recommends investigating these files.
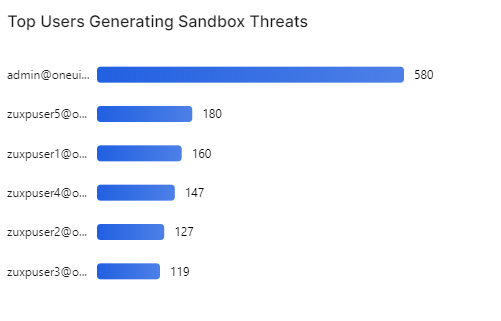
Close - Top Users Generating Sandbox Threats
This bar chart shows the users who generated the most sandbox threats in your organization and the number of threats generated.
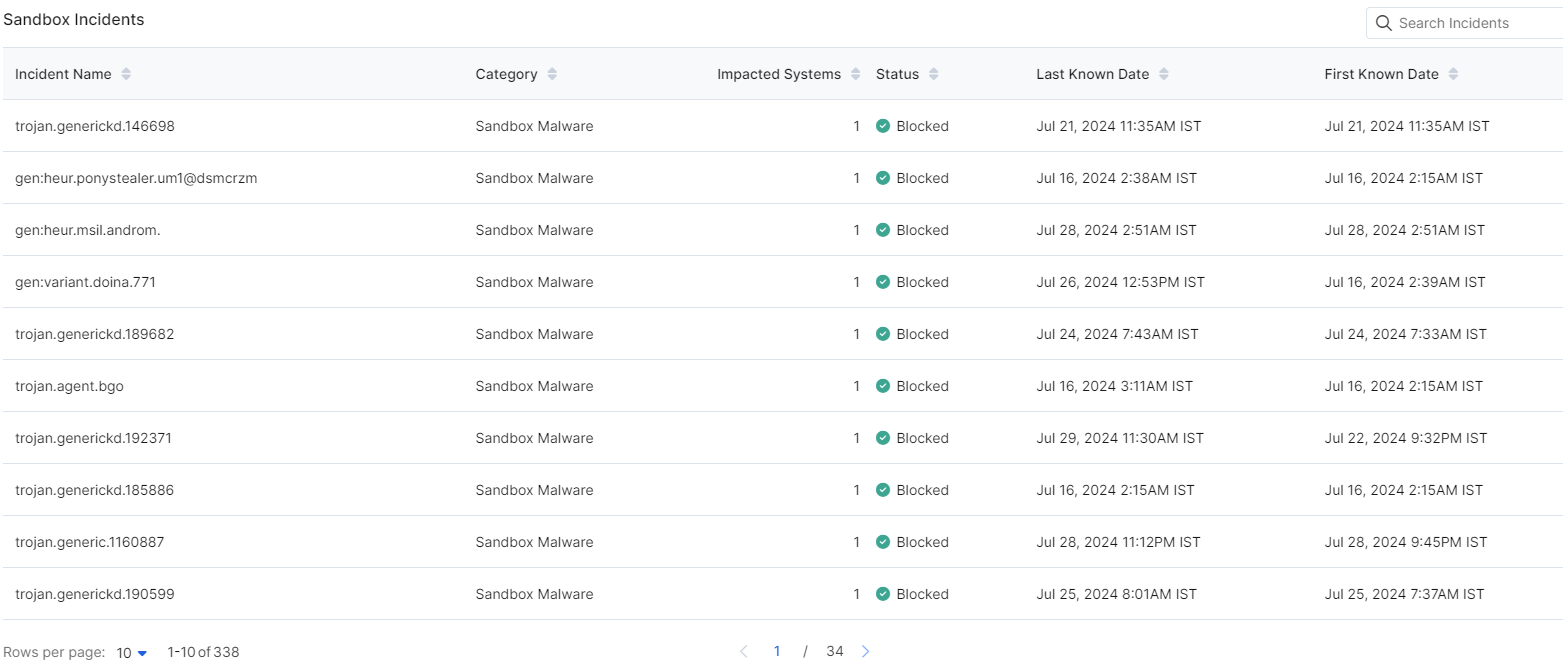
Close - Sandbox Incidents
This table provides a detailed list of sandbox incidents for the specified time range and category.
- Name: The name of the threat incident.
- Category: The threat category (e.g. Sandbox Malware, Sandbox Adware, etc.)
- Impacted Systems: The number of systems affected by the incident.
- Status: The action taken on the threat, e.g. Allowed or Blocked.
- Last Known Date: The date and time of the last known attempt by the threat.
- First Known Date: The date and time of the first known attempt by the threat.
Click any row in the table to see additional detail on that sandbox threat incident on two tabs:
- The Details tab has information about the threat:
- Policy Action: The policy action enforced on transactions related to the incident.
- Event Type: The type of threat event.
- Last Known Attempt: The date and time of the last known attempt by the threat.
- First Known Attempt: The date and time of the first known attempt by the threat.
- Duration: The duration between the first and last known attempt by the threat.
- Total Transactions: The total number of transactions related to the threat.
- Total Bytes: The total bytes of data for all the transactions related to the threat.
- File Name: The name of the file related to the incident.
- Sandbox Category: The name of the sandbox category, if the file is sent for sandbox analysis.
- File Type: The type of file involved in the incident.
- File Size: The file size involved in the incident.
- MD5: The MD5 hash for the file that triggered the rule.
- SHA-2 (256-bit): The hash of identical files.
- Destination IP: The destination IP.
- Hostname: The hostname involved in the incident.
- Application Category: The application category related to the incident, if applicable.
- Application: The name of the application involved in the incident, if applicable.
- URL Category: The URL category of the incident.
- The Impacted Systems tab has information about the systems and users affected by the threat:
- User Name: The name of the user.
- Client IP: The IP address from which the transaction originated. This is the IP address of the client device.
- Client External IP: The internet gateway location IP address of the client.
- Last Known Attempt: The date and time of the last known attempt by the threat for the user.
- First Known Attempt: The date and time of the first known attempt by the threat for the user.


