Experience Center
Monitoring the Incidents Dashboard
The Incidents Dashboard displays incidents in five area types: Wi-Fi, Last Mile ISP, Internet & SaaS Public Service Edge, Private Applications, or Application. Incidents are issues that impact the device performance of multiple users. Digital Experience Monitoring uses artificial intelligence and machine learning (AI/ML) to detect and identify incidents using the best metrics that correlate to the issues. The incidents displayed are based on the selected time frame range in the UI and show incidents over time, impacted users, and where on the map they occur.
Prerequisites
To access the Incidents Dashboard (Analytics > Digital Experience Management > Dashboard > Incidents Dashboard), you must have the following:
- Your Digital Experience Monitoring subscription level supports Incidents. To learn more, see Ranges and Limitations.
- View Only permission level for Incidents Dashboard. To learn more, see About Digital Experience Monitoring Role-Based Administration.
Incidents Dashboard
Use the filters on the Incidents Dashboard page to narrow your scope of Incidents information.
- Geolocations: Select the geographic areas where users access their devices.
- Type: Select the type for incidents. The types are Wi-Fi, Last Mile ISP, ZIA Public Service Edge, ZPA, or Application.
- Time Range: Select a time range to view when incidents occurred. The default is 14 days.
You can view the total incidents and the total counts across the key metrics and impacted users.
- Total Incidents: The total number of incidents detected within a time range.
- Impacted Users: The number of impacted users from the total incidents within a time range.
Incidents Across Key Areas: The distribution of incidents across the key areas.
You can click the number, icon, or text under each key area to filter specifically for the selected Incident type.
If no incidents are found, try one of the following actions:
- Select a different time range.
- Remove filters.
- Apply different filters.
Incidents Over Time
The Incidents Over Time section displays data for incidents and impacted users to provide the following information:
- Incidents Over Time: The number of incidents that have occurred based on the impacted devices within a time range.
- Impacted Users Over Time: The number of impacted users from the incident over time. If there are no impacted users, no data is shown.
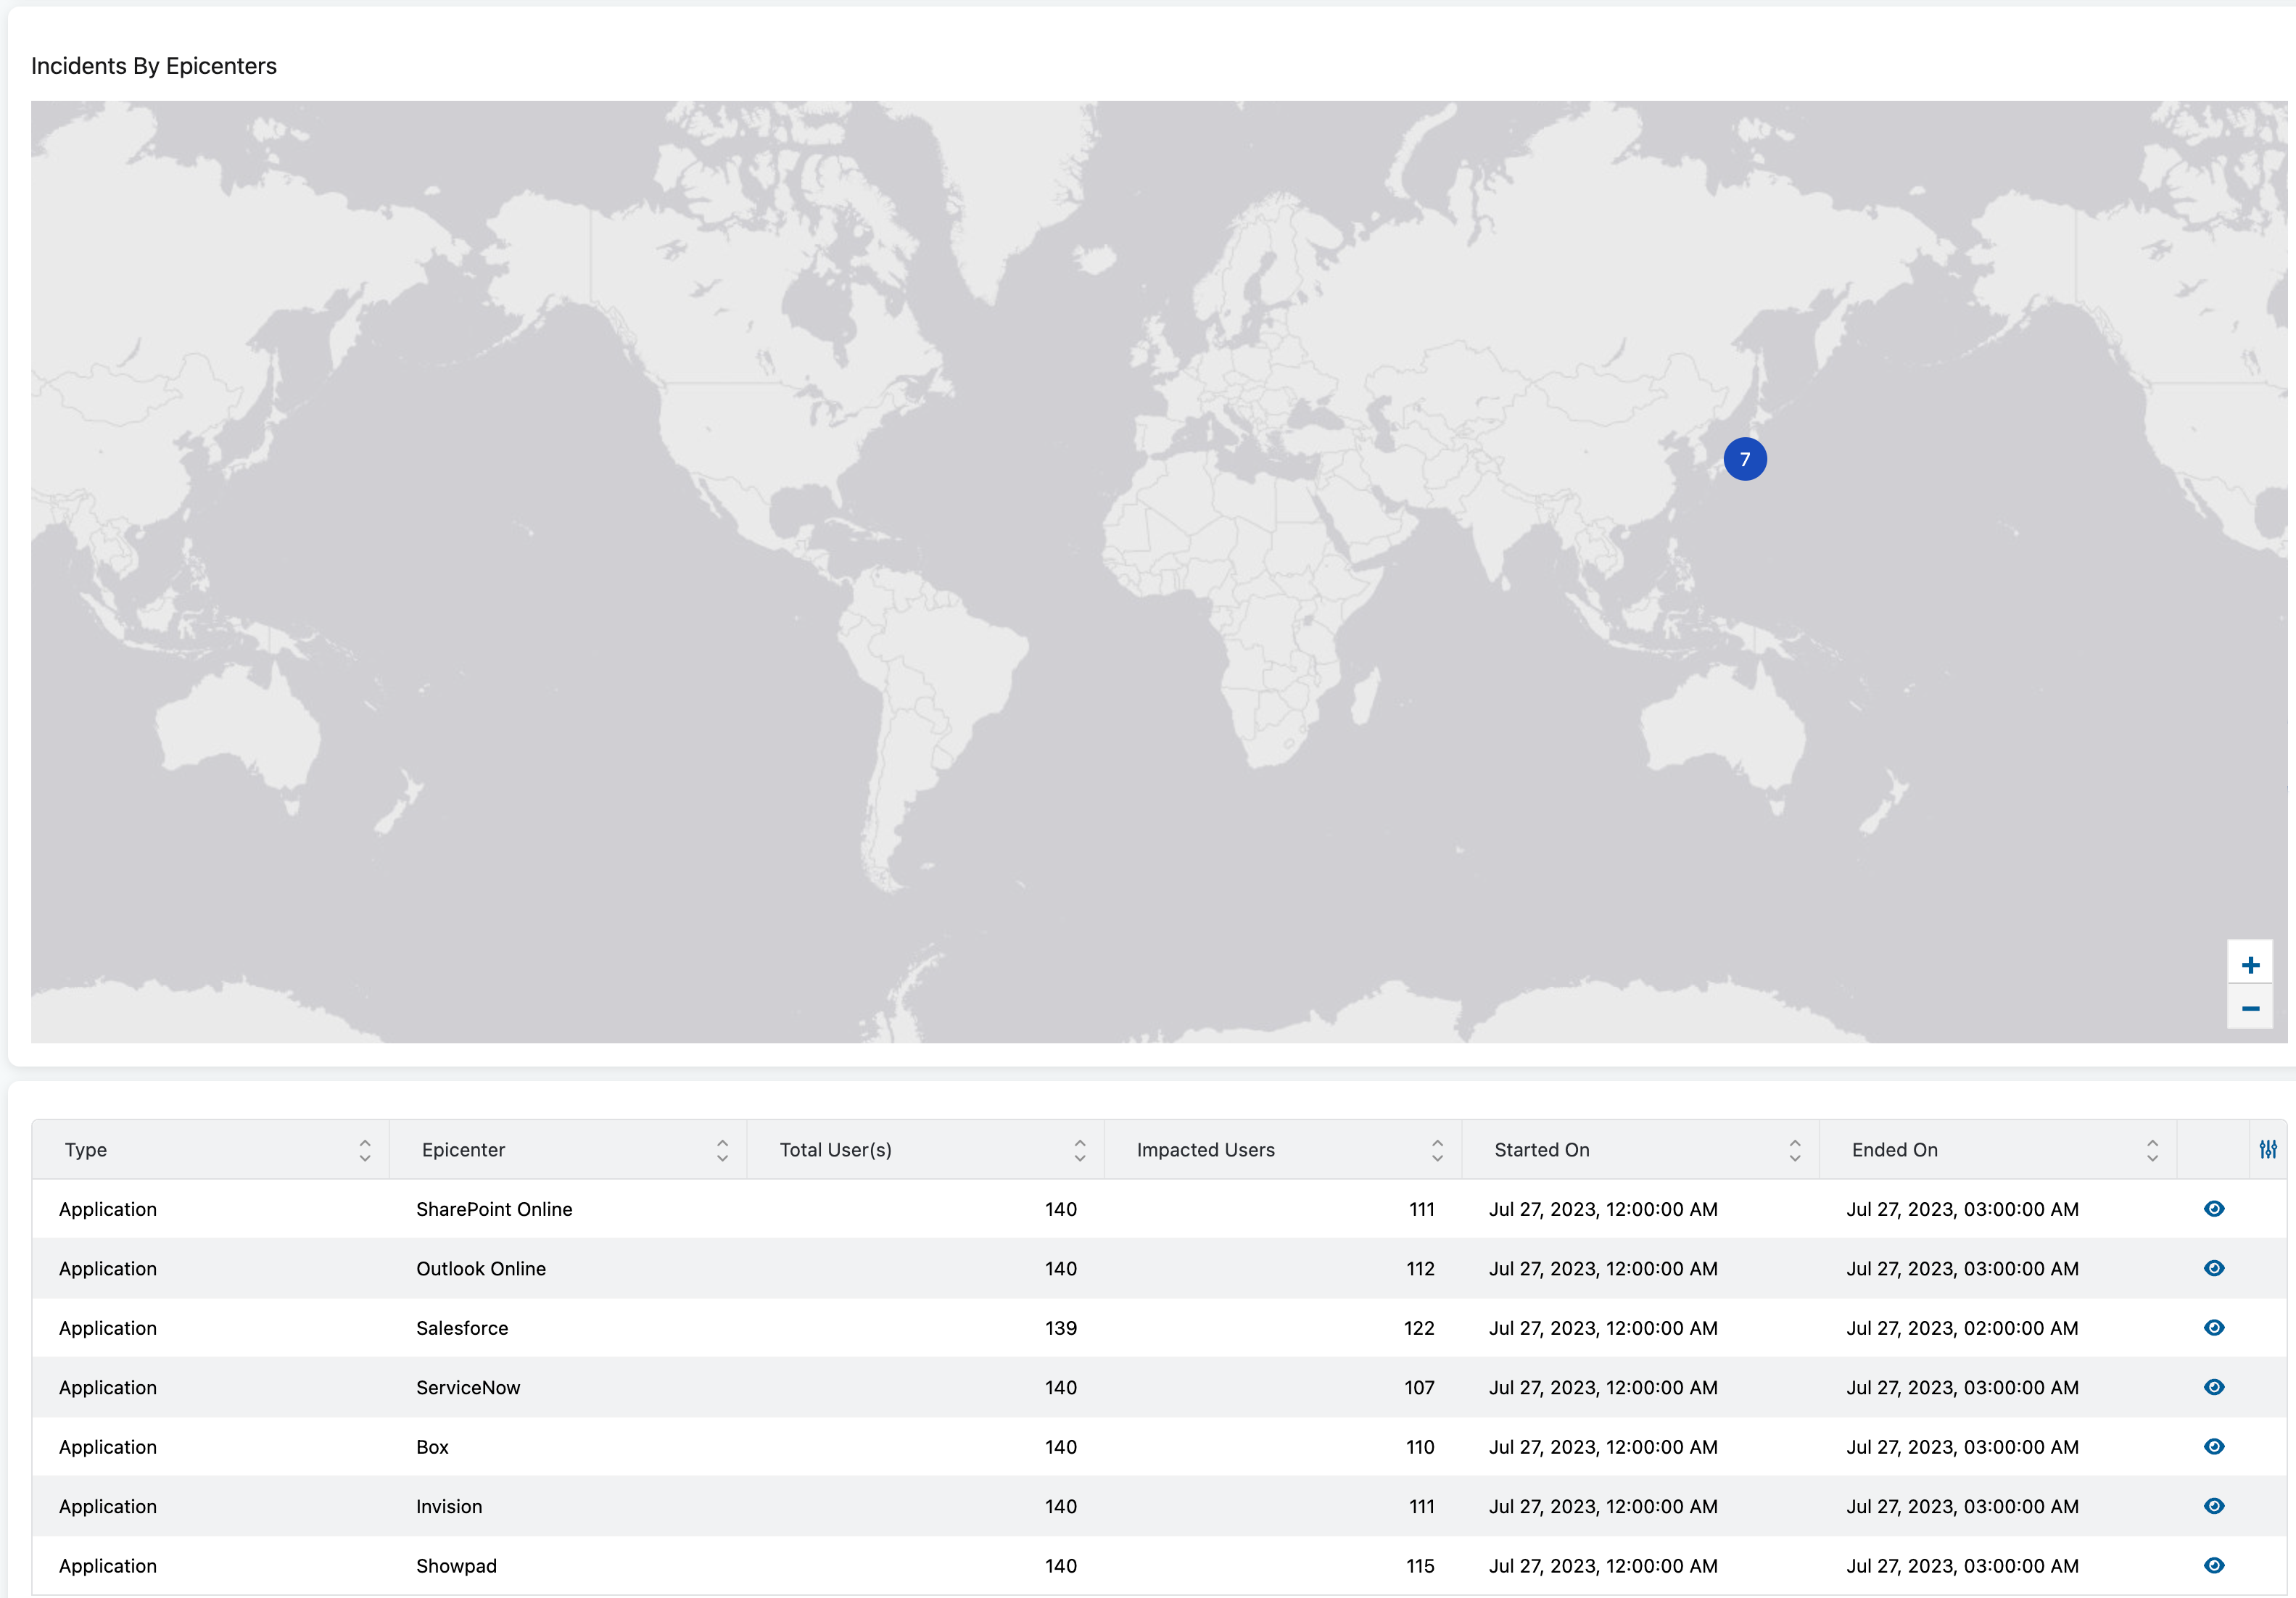
Incidents By Epicenters
The Incidents By Epicenters displays all incidents that have occurred within the time range on a map. Different types of incidents (e.g., Wi-Fi, Last Mile ISP, Internet & SaaS Public Service Edge, Private Applications Public Service Edge, or Application) are displayed using a different icon to represent the types of incidents occurring. After an incident is positioned on the map in an area, an epicenter is defined at the center of the incident.
You can review the Incidents by Epicenters list with the following information:
- Type: The types are Wi-Fi, Last Mile ISP, ZIA Public Service Edge, ZPA Public Service Edge, or Application.
- Epicenter: Represents the center of the incident. Depending on the type, the epicenter is displayed as:
- Wi-Fi: The geographical area of impacted service set identifiers (SSIDs).
Last Mile ISP: The geographical area of impacted users with the ISP.
- Blackout: A subtype of Last Mile ISP. The area of impacted users with connectivity issues on the Last Mile ISP.
- Brownout: A subtype of Last Mile ISP. The area of impacted users with a performance degradation on the Last Mile ISP.
Click Last Mile ISP under Incidents Across Key Areas or the View icon underneath the Incidents by Epicenter map to view what subtype of Last Mile ISP Incident occurred.
- ZIA Public Service Edge: The location of the Internet & SaaS Public Service Edge at the Zscaler Data Center.
- ZPA: The geographical area of impacted users with Private Applications.
- ZPA App Connector: The location of the Private Applications App Connector at the Zscaler Data Center.
- ZPA Public Service Edge: The location of the Private Applications Public Service Edge at the Zscaler Data Center.
- Application: The area of impacted users and can go across multiple countries.
- Total User(s): The total number of users within the incident.
- Impacted Users: The number of impacted users within the incident.
- Started On: The date and time this incident started.
- Ended On: The date and time this incident ended.
- View: You view the selected incident for more granular details.
Viewing Incident Details
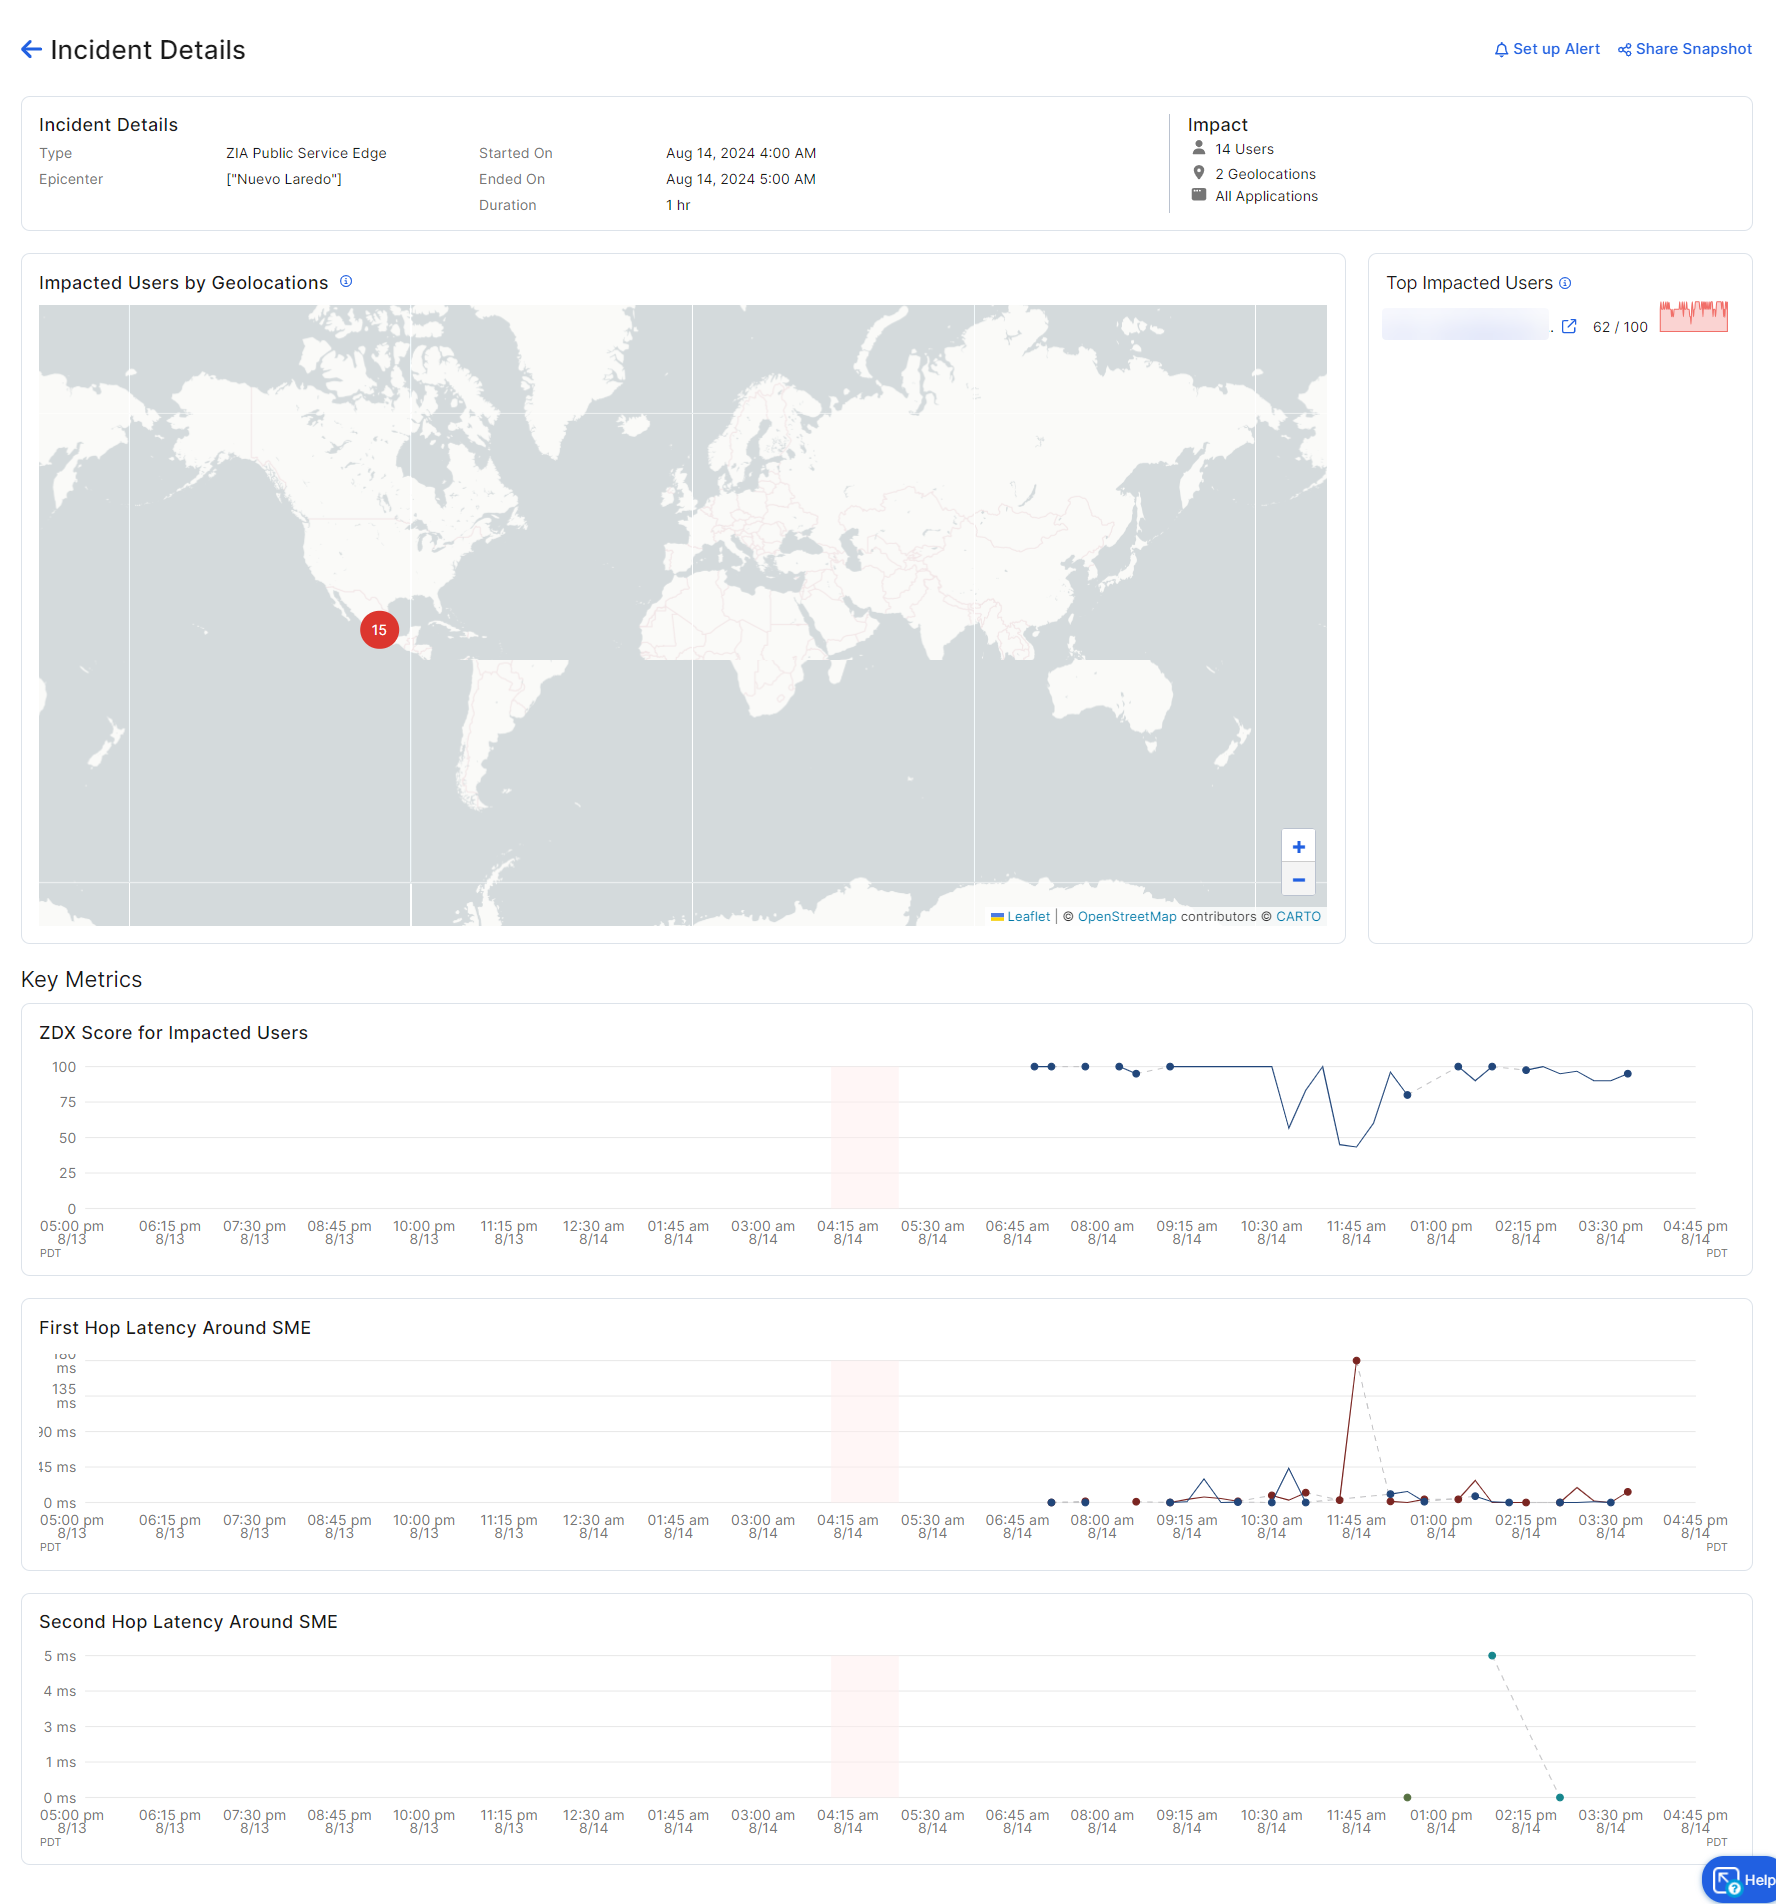
The Incident Details page provides granular information about a specific incident:
- Incident Details
Provides an overview of the selected incident with the following details:
- Type: The type of incident.
- Severity: The level of severity of the incident.
- Epicenter: Represents the center of the incident depending on the type. Depending on the type, the epicenter is displayed as:
- Wi-Fi: The geographical area of impacted SSIDs.
- Last Mile ISP: The geographical area of impacted users with the ISP.
- Blackout: A subtype of Last Mile ISP. The area of impacted users with connectivity issues on the Last Mile ISP.
- Brownout: A subtype of Last Mile ISP. The area of impacted users with a performance degradation on the Last Mile ISP.
- ZIA Public Service Edge: The location of the Internet & SaaS Public Service Edge at the Zscaler Data Center.
- ZPA: The geographical area of impacted users with Private Applications.
- ZPA App Connector: The location of the Private Applications App Connector at the Zscaler Data Center.
- ZPA Public Service Edge: The location of the Private Applications Public Service Edge at the Zscaler Data Center.
- Application: The area of impacted users and can go across multiple countries.
- Started On: The date and time the incident started.
- Ended On: The date and time the incident ended.
- Duration: The duration of the incident.
- Impact
Displays the number of users, geolocations, and applications impacted.
 : The number of impacted users.
 : The number of impacted geolocations.
 : The number of applications.
- Impacted Users by Geolocations
A map of the impacted users' geolocations. You can zoom in and out of the map to better view regions of interest.
Close - Top Impacted Users
A list of the Top Impacted Users. Click View All Impacted Users to view and verify more impacted users.
The Top Impacted Users list displays up to 11 impacted users.
Close - Key Metrics
Displays key metrics based on the Incident type.
- Wi-Fi
Wi-Fi Key Metrics provide an overview of the signal strength and latency of Wi-Fi access points.
- ZDX Score Drop: The ZDX Score variation through the Wi-Fi access point.
- Maximum Wi-Fi Access Point Latency: The maximum Wi-Fi Access Point Latency.
- Average Wi-Fi Access Point Latency: The average Wi-Fi Access Point Latency.
- Packet Loss at Wi-Fi Access Point (Hop 1): The packet loss at the first Wi-Fi Access Point.
- Packet Loss after Wi-Fi Access Point (Hop 2): The packet loss after the 1st Wi-Fi Access Point.
- Packet Loss after Wi-Fi Access Point (Hop 3): The packet loss after the 2nd Wi-Fi Access Point.
- Packet Loss after Wi-Fi Access Point (Hop 4): The packet loss after the 3rd Wi-Fi Access Point.
- Wi-Fi Signal Strength: The average signal strength of users going through the Wi-Fi Access Point.
- Last Mile ISP
Depending on if it's a Blackout or Brownout, you get different key metrics.
- Blackout
Blackouts Key Metrics provides an overview of connectivity issues with an ISP.
- Application Score: The ZDX Score of the application.
- All Probe Errors: The total number of probe errors.
- DNS Resolution Time: The amount of time it takes for a DNS to resolve DNS entries.
- Cloud Path Probe Errors: The number of Cloud Path probe errors.
- Brownout
Brownouts Key Metrics provides an overview of performance degradation with an ISP.
- ZDX Score Drop: The shaded region indicates the ZDX Score Drop for the Last Mile ISP incident.
- DNS Latency: The amount of time DNS takes to resolve for impacted users from the Last Mile ISP incident.
- Leg Latency: The latency for impacted legs from the Last Mile ISP incident.
- Packet Loss: The number of packets lost from the Last Mile ISP incident.
- Blackout
- ZIA Public Service Edge
Internet & SaaS Public Service Edge provides an overview on Internet & SaaS transactions, connectivity, and latency for impacted users.
- ZDX Score for Impacted Users: The ZDX Score for Impacted Users is calculated across each impacted user and their aggregated ZDX Score from all their configured applications.
- First Hop Latency around PSE: The time calculated, from the Public Service Edge (PSE) perspective, across all the users going through the affected Zscaler Data Center.
- Second Hop Latency around PSE: The average Second Hop Latency, from the PSE perspective, across all the users going through the affected Zscaler Data Center.
- ZIA Transactions: Displays the number of Internet & SaaS transactions going through the affected Zscaler Data Center.
- ZIA Connectivity Errors: Displays the number of Internet & SaaS errors connecting to the affected Zscaler Data Center.
- Cloud Path Probe Errors: The number of Cloud Path probe errors at the Zscaler Data Center.
- Web Probe Errors: The number of Web probe errors at the Zscaler Data Center.
- ZPA
Depending on the Service Edge, you get different key metrics.
- ZPA App Connector
ZPA App Connector key metrics provides an overview of Private Applications App Connector traffic, connectivity, and latency for impacted users.
- ZDX Score: The ZDX Score is calculated across each impacted user and their aggregated ZDX Score from all their configured applications.
- First Hop Latency Around ZPA: The average First Hop Latency across all the users going through Private Applications.
- Second Hop Latency Around ZPA: The average Second Hop Latency across all the users going through Private Applications.
- ZPA App Connector Cloud Path Probe Errors: The number of Cloud Path probe errors at the Zscaler Data Center.
- ZPA Public Service Edge
Private Applications Public Service Edge provides an overview of Private Applications Public Service Edge traffic, connectivity, and latency for impacted users.
- ZDX Score: The ZDX Score is calculated across each impacted user and their aggregated ZDX Score from all their configured applications.
- First Hop Latency around ZPA: The average First Hop Latency, from the Public Service Edge perspective, across all the users going through Private Applications.
- Second Hop Latency around ZPA: The average Second Hop Latency, from the Public Service Edge perspective, across all the users going through Private Applications.
- ZPA Public Service Edge Cloud Path Probe Errors: The number of Cloud Path probe errors at the Zscaler Data Center.
- ZPA Public Service Edge Web Probe Errors: The number of Private Applications Public Service Edge Web probe errors at the Zscaler Data Center.
- ZPA App Connector
- Application
Application Key Metrics provide an overview of an application and its impacted users.
- ZDX Score: The ZDX Score of the application.
- HTTP Errors: The number of HTTP errors the application has encountered over time.
- TTFB-PFT Ratio: The ratio between the server response time (time to first byte) and the time to load the page (page fetch time).
- Last Server Leg Latency: The latency from the Public Service Edge to the application.
- Number of Redirects: The number of redirections going through the application over time.
- Wi-Fi
Click Set Up Alert ( ) if you want to configure an alert rule for an incident. To learn more, see Configuring an Alert Rule.
The following is an example of a selected Application Incident. Depending on the type of incident you have, you have different key metrics.
 Close
Close


