Zero Trust Device Segmentation
Monitoring & Logs
Zero Trust Device Segmentation allows you to monitor and troubleshoot your network using packet logs and flow logs.
By default, Zscaler only logs the traffic flow once per hour based on the 4-tuple (source IP address, destination IP address, destination port, protocol) for each policy match. For example, an admin creates a policy denying access sourced from any IP address and destined for 8.8.8.8 on port 53. If Host A sends multiple DNS requests to 8.8.8.8, then only one request is logged within an hour. If Host B does the same thing, then only a single entry appears for Host B. If Host A or B repeats this process after an hour, a new entry appears in the log.
To enable more verbose logging, select Disable Log Throttling when you add or edit a policy. To learn more, see Managing Segmentation Policies.
Packet Logs
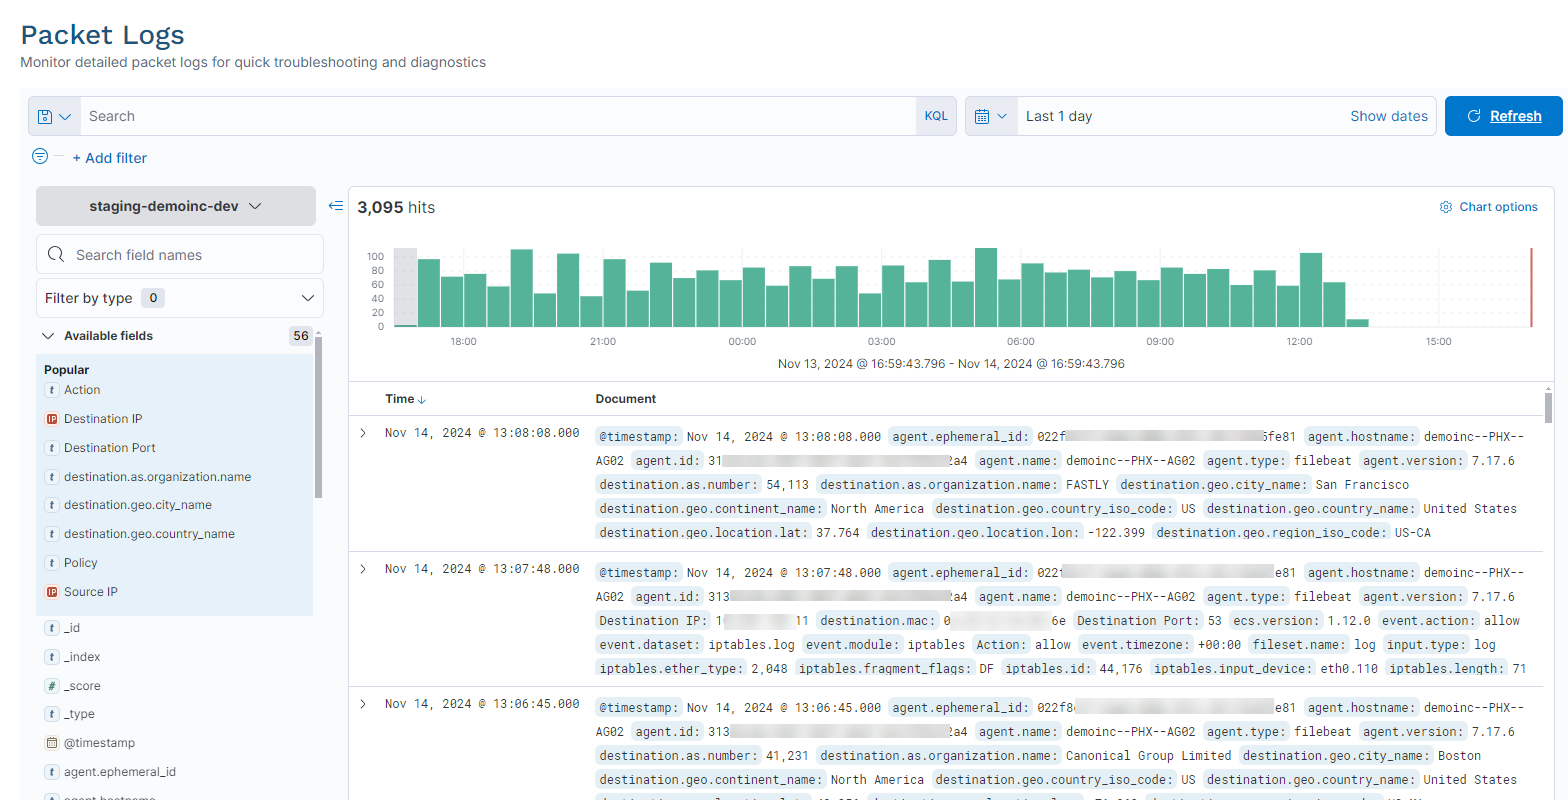
Packet logs provide a rich set of data that allows you to analyze traffic flowing through a network, providing insight into traffic patterns and helping you to troubleshoot issues.
You can filter them by a number of attributes, including source (e.g., IP address, port, OS, browser, or geolocation), destination (e.g., name, location, country, IP address, or port), and host (name and OS).
To access packet logs, go to Monitoring & Logs > Packet Logs.
See image.
Flow Logs
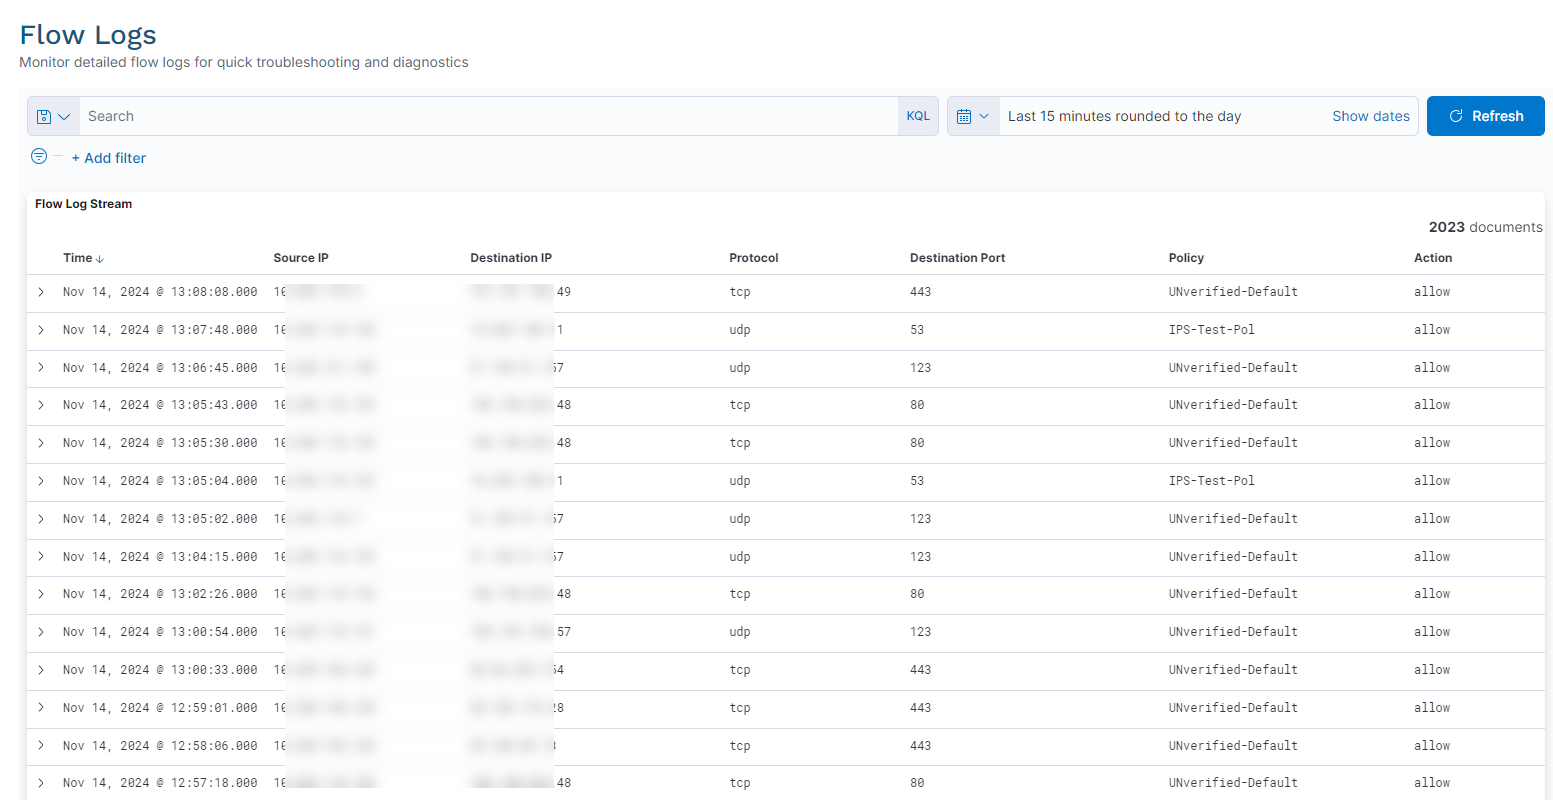
Flow logs help you to troubleshoot issues using session flow details for a source/destination pair and a policy/action set.
You can filter them by a number of attributes, including source (e.g., IP address, port, OS, browser, or geolocation), destination (e.g., name, location, country, IP address, or port), and more.
To access flow logs, go to Monitoring & Logs > Flow Logs.
See image.

