Experience Center
Viewing the Source IP Anchoring Dashboard
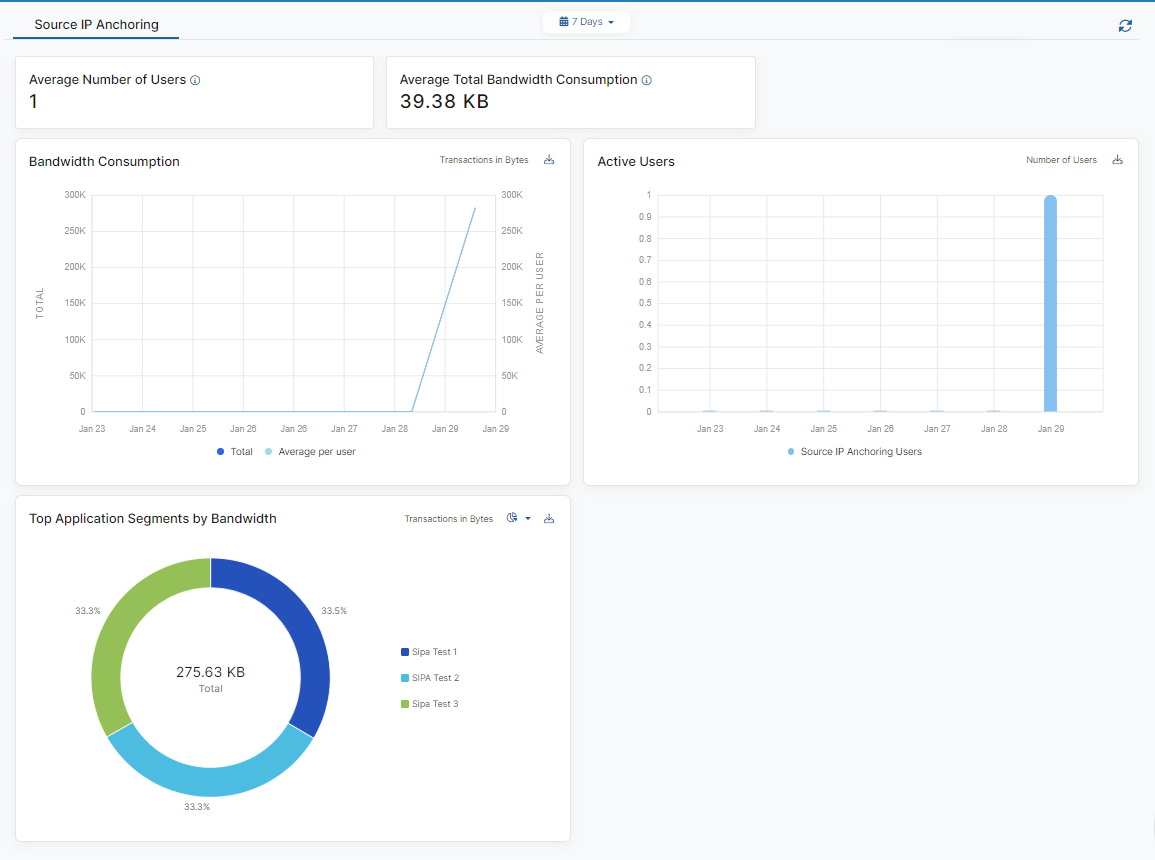
The Source IP Anchoring dashboard (Analytics > Reports > Private Applications > Source IP Anchoring) provides information about your organization's Source IP Anchoring connections.
Dashboard Tools
The Source IP Anchoring dashboard displays the following information and functionality:
- Time Range Filter: View Source IP Anchoring data over a period between 7 Days to 6 Months, or you can select Custom Range. This filter applies to all widgets on the dashboard. By default, the dashboard displays information for events that occurred in the last 7 days.
- Refresh icon: Refresh the dashboard to reflect the most current information.
- Average Number of Users: View real-time information about the number of users per day or month for the selected time period.
- Average Total Bandwidth Consumption: View real-time information about the average bandwidth consumed per day or month for the selected time period.

Widgets
The Source IP Anchoring dashboard provides the following widgets:
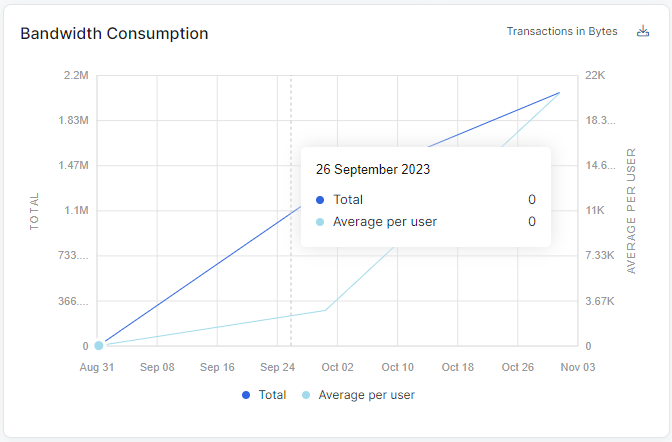
- Bandwidth Consumption
The widget displays total and average per user bandwidth consumption for the selected time interval.

- Hover over a date to view:
- Total: The total bandwidth consumed for Source IP Anchoring applications.
- Average per user: The average bandwidth consumed per user.
- Click the Download icon (
 ) to export a file (.csv) containing information on the total bandwidth consumed and average bandwidth consumed per user for the time interval.
- Hover over a date to view:
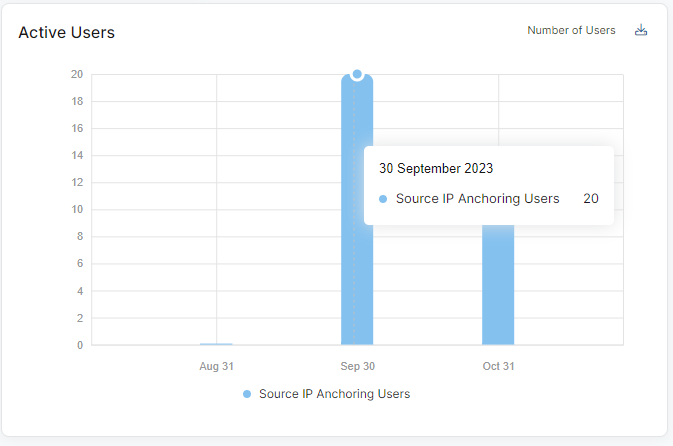
- Active Users
The widget displays the total unique Source IP Anchoring users for the selected time interval.

- Hover over a date to view the number of active Source IP Anchoring users by date.
- Click the Download icon (
 ) to export a file (.csv) containing information on the number of active Source IP Anchoring users for the time interval.
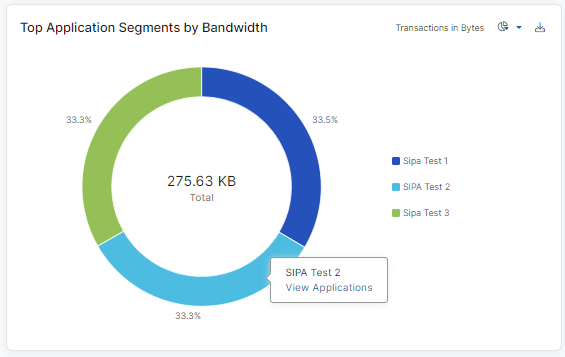
- Top Application Segments by Bandwidth
The widget displays the top application segments by bandwidth for the selected time interval.

- Hover over a section of the pie or horizontal bar chart to see the applications. Click View Applications to view the top five applications for the selected application segment.
- Click the Pie or Bar icon (
 ) to display data in pie or bar format.
 - Click the Download icon (
 ) to export a file (.csv) containing information on top application segments by bandwidth.
