Experience Center
Viewing the App Connectors Dashboard
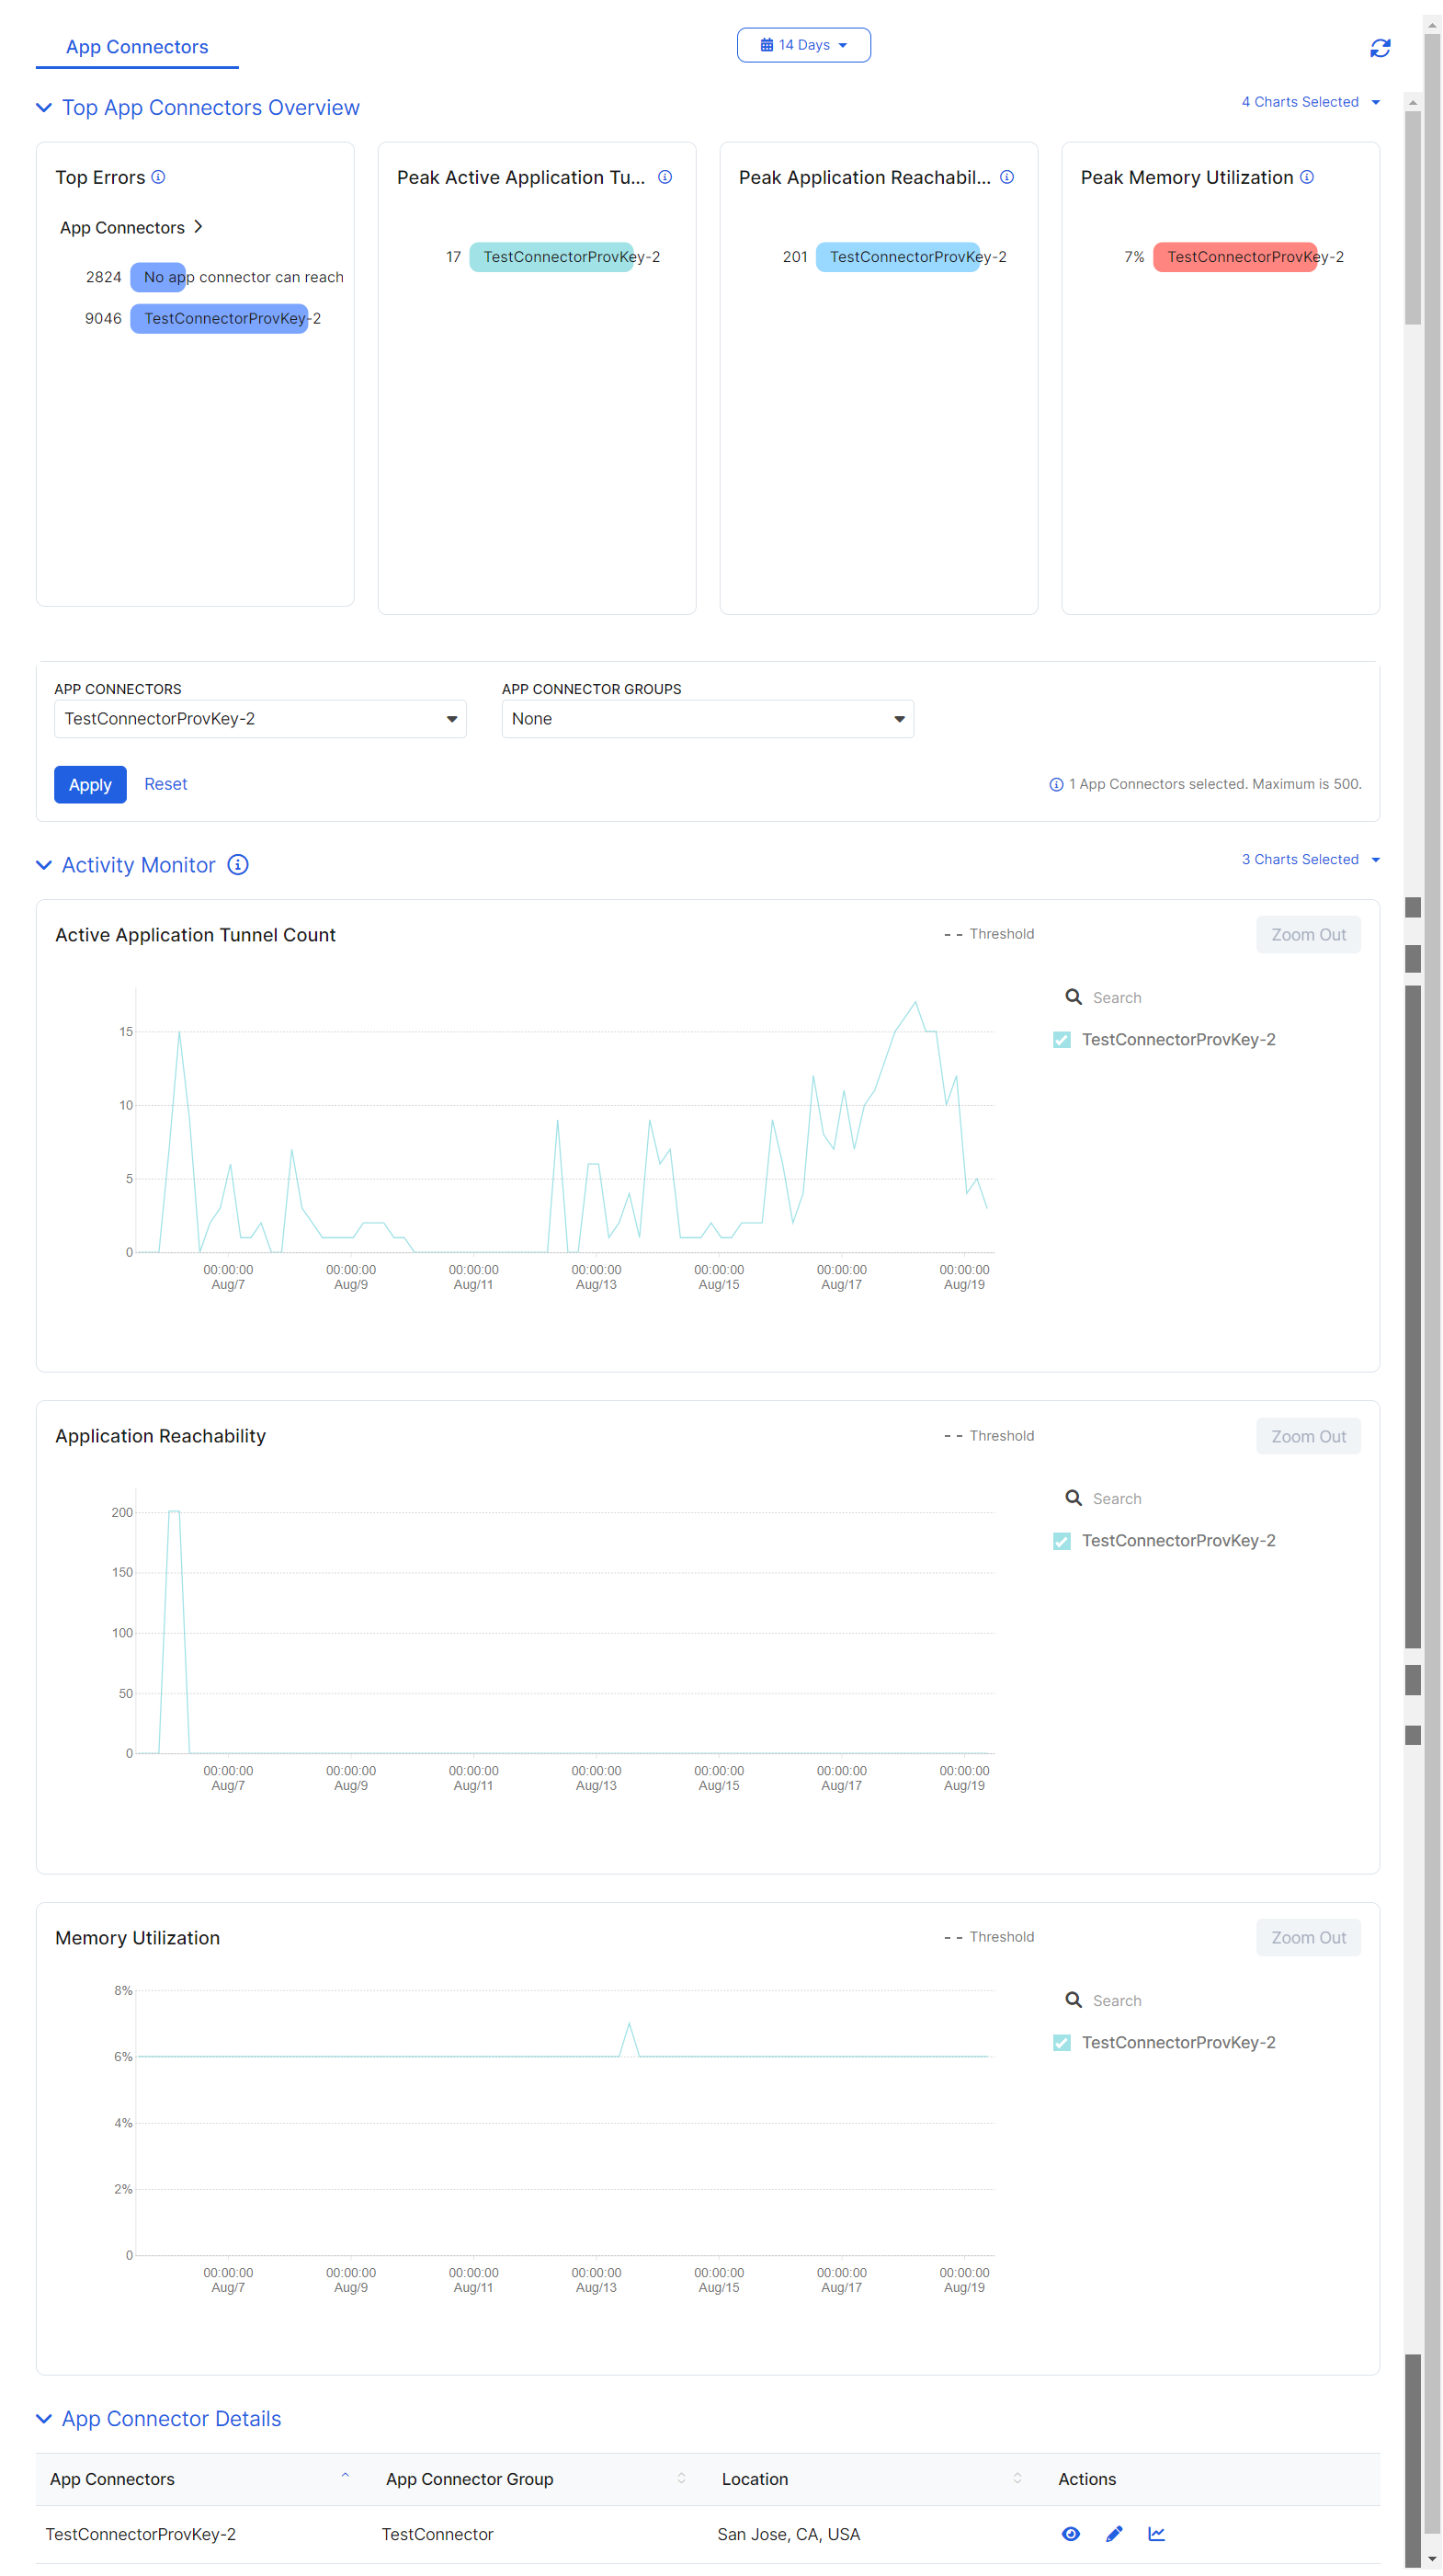
The App Connectors dashboard (Analytics > Reports > Private Applications > App Connectors) provides information about the App Connectors for your organization.
Dashboard Tools
The App Connectors dashboard displays the following information and functionality:
- Time Period Filter: View user data over a period between 30 Mins to 14 Days, or you can select Custom Range to specify a custom start and end date. If you use Custom Range, the start date can be within the last 14 days. This filter applies to all widgets on the dashboard. By default, the dashboard displays information for events that occurred in the last 30 minutes.
Due to the way data is aggregated for different time period filters, the same point in time in an Activity Monitor widget may show slightly different values depending on the time chosen. For example, the data with the 30 mins time period filter at 3:00 PM may not match the data with the 14 Days time period filter for the same date at 3:00 PM.
- Refresh Icon: Refresh the dashboard to reflect the most current information. The dashboard displays the most recent information from the last five minutes.
Top App Connector Widgets
The Top App Connector widgets provide an overview of the peak or top metrics for the relevant App Connectors in the selected time range.
Four widgets are selected automatically when you access the dashboard. At least four widgets must be selected for the widgets to display, and no more than 8 widgets are available to view at one time.
- Top Errors: Displays up to the top 100 App Connectors that had the most errors in the selected time range. This widget displays automatically when first accessing the dashboard.
- Peak Active Application Tunnel Count: Displays up to the top 10 App Connectors that have the highest active connections to applications in the selected time range. This widget displays automatically when first accessing the dashboard.
- Peak Active Connections to Private Service Edges: Displays up to the top 10 App Connectors with the highest active connections to Private Service Edges for Private Applications in the selected time range.
- Peak Active Connections to Public Service Edges: Displays up to the top 10 App Connectors with the highest active connections to Public Service Edges Private Applications in the selected time range.
- Minimum Available Disk Space: Displays up to the top 10 App Connectors has the least disk space available in the selected time frame. This is not the average disk space used over the time frame.
- Peak Application Reachability: Displays up to the top 10 App Connectors monitoring the most application targets in the selected time range. This widget displays automatically when first accessing the dashboard.
- Peak CPU Utilization: Displays up to the top 10 App Connectors using the most CPU in the selected time frame. This is not the average CPU used over the time frame.
- Peak Memory Utilization: Displays up to the top 10 App Connectors using the most memory in the selected time frame. This is not the average memory used over the time frame. This widget displays automatically when first accessing the dashboard.
- Peak TCP Port Utilization: Displays up to the top 10 App Connectors using the most TCP ports for IPv4 in the selected time frame. This is not the average TCP ports used over the time frame, and it does not show App Connectors using TCP ports for IPv6.
- Peak UDP Port Utilization: Displays up to the top 10 App Connectors using the most UDP ports for IPv4 in the selected time frame. This is not the average UDP ports used over the time frame, and it does not show App Connectors using UDP ports for IPv6.
- Peak File Descriptor Utilization: Displays up to the top 10 App Connectors using the most file descriptors in the selected time frame. This is not the average file descriptors used over the time frame.
- Total Application Tunnel Count: Displays up to the top 10 App Connectors that have the highest cumulative connections to applications in the selected time range.
- Total Bytes Received from Public Service Edges: Displays up to the top 10 App Connectors that has the highest cumulative received bytes from Public Service Edges for Private Applications in the selected time range.
- Total Bytes Transmitted to Public Service Edges: Displays up to the top 10 App Connectors that has the highest cumulative transmitted bytes to Public Service Edges for Private Applications in the selected time range.
- Peak Inspection Tunnel Count in Past 14 Days: Displays up to the top 10 App Connectors that have the highest connections to AppProtection in the past 14 days.
Clicking on any of the App Connectors in the widgets takes you to the User Activity Diagnostic logs page filtered for this App Connector.
Activity Monitor Widgets
The Activity Monitor widgets provide trend information about selected App Connectors in the selected time range. If no App Connectors are selected, the top App Connectors from the Peak Memory Utilization widget are selected by default.
Three widgets are selected automatically when you access the dashboard. At least three widgets must be selected for the widgets to display, and no more than 6 widgets are available to view at one time.
- Active Application Tunnel Count: The number of active connections the App Connector had to applications for the point in time listed. This widget displays automatically when first accessing the dashboard.
- Active Connections to Private Service Edges: The number of active connections the App Connector had to Private Service Edges for Private Applications in the selected time range.
- Active Connections to Public Service Edges: The number of active connections the App Connector had to Public Service Edges for Private Applications in the selected time range.
- Available Disk Space: Displays the amount of disk space that is available to an App Connector at different points during the selected time range.
- Rate of Bits Received from Public Service Edge: The number of bits received per second by the App Connector from Public Service Edges for Private Applications in the selected time range. The rate is measured by taking the total bytes (b) for two points in time counted in seconds (t): rate= (b2-b1) */(t2-t1). For example, there are 100 total bytes at 7:00, and 1000 total bytes at 7:05. The rate is 24 bits per second ((1000-100)*8 / 300 = 24 bits/second).
- Application Reachability: Displays the number of application targets for an App Connector at different points during the selected time range. This widget displays automatically when first accessing the dashboard.
- CPU Utilization: Displays the amount of CPU used by an App Connector at different points during the selected time range.
- Memory Utilization: Displays the amount of memory used by an App Connector at different points during the selected time range. This widget displays automatically when first accessing the dashboard.
- TCP Port Utilization: Displays the number of TCP ports for IPv4 used by an App Connector at different points during the selected time range. It does not show App Connectors using TCP ports for IPv6.
- UDP Port Utilization: Displays the number of UDP ports for IPv4 used by an App Connector at different points during the selected time range. It does not show App Connectors using UDP ports for IPv6.
- File Descriptor Utilization: Displays the number of file descriptors used by an App Connector at different points during the selected time range.
- Rate of Bits Transmitted to Public Service Edges: The number of bits transmitted per second by the App Connector to Public Service Edges for Private Applications during the selected time range. The rate is measured by taking the total bytes (b) for two points in time counted in seconds (t): rate= (b2-b1) */(t2-t1). For example, there are 100 total bytes at 7:00, and 1000 total bytes at 7:05. The rate is 24 bits per second ((1000-100)*8 / 300 = 24 bits/second).
- Application Tunnel Creation Rate: Compare the rate of application tunnels interacting with App Connectors for application connections in the selected time range. The rate is measured by taking the total application tunnels (a) for two points in time counted in seconds (t): rate= (a2-a1) / (t2-t1). For example, there are 100 total application tunnels at 7:00, and 400 total application tunnels at 7:05. The rate is one tunnel per second ((400-100) / 300 = 1 tunnel/second).
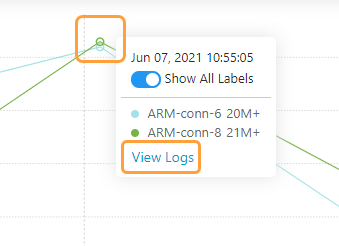
Widgets may show solid lines or dashed lines. Solid lines represent actual data for the time period. Dashed lines indicate the expected trajectory of the data, but it isn't actual data. You can select a point on the lines in a widget to see the exact date, time, and relevant numbers for the App Connectors as related to the particular widget. You can also click View Logs to see the User Activity Diagnostic logs page filtered for the App Connectors in the widget.
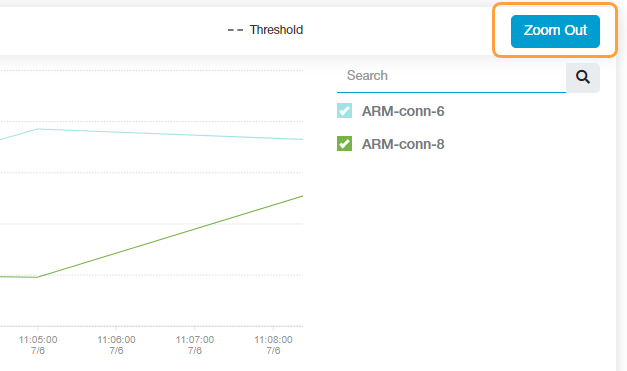
A Plus (+) icon appears as you move over the widgets. Use this icon to select the time period to zoom in for greater detail. A blue box shows the chosen portion of the widget, and the widget shows this selected smaller time period.
Click Zoom out to view the original widget.
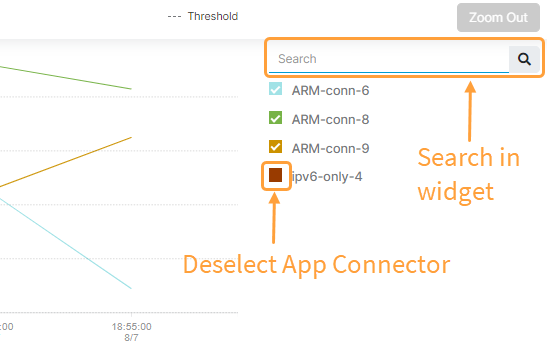
For each widget, you can deselect the listed App Connectors to change what items are tracked within the widget. You can also search within the widget to reduce the listed App Connectors that appear in the widget. To search, enter part or all of an App Connector name or use the following search query options with >, <, or = operators:
- name: The name of the App Connector (e.g., name = MyAppConnector).
- value: A numerical value specific to the widget (e.g., value < 40).
Filtering App Connectors
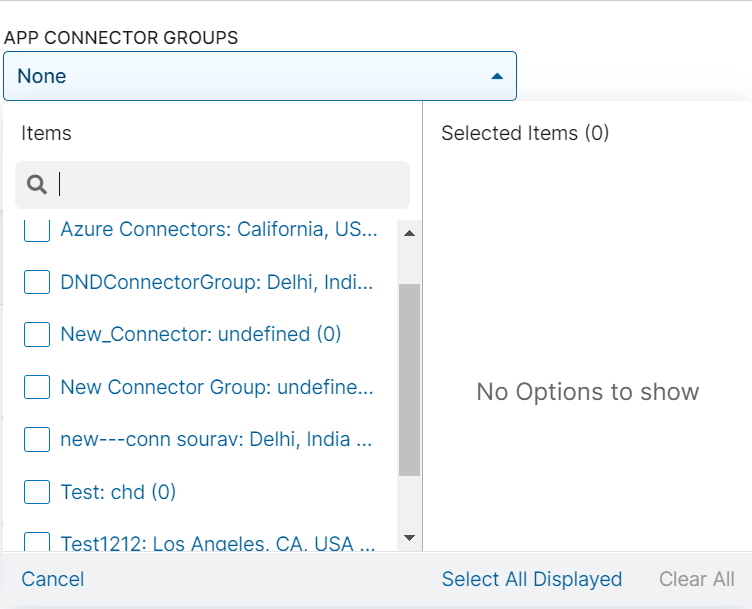
You can filter the Activity Monitor charts and App Connector Details table by selecting the App Connectors you want to review. The filters available are App Connectors and App Connector Groups.
When filtering by App Connectors and App Connector Groups, the selected App Connectors and App Connectors within the selected App Connectors groups are shown. Click here to view an example.
- Let's say there is App Connector Group 1, which contains App Connectors A and B, and then App Connector Group 2, which contains App Connectors C and D.
- If App Connector Group 1 and App Connector C is selected, the dashboard shows App Connectors A, B, and C, rather than showing no App Connectors because C is not part of App Connector Group 1.
The filters between App Connectors and App Connector Groups use the OR operator, instead of AND, to help compare App Connectors in App Connector Groups.
There is a limit of 25 App Connectors you can select at one time. If you haven't selected any App Connectors and select an App Connector group that contains more than 25 App Connectors, then the first 25 App Connectors for the selected App Connector Group are used in the filter. If you select App Connectors and then select App Connector groups in a way that exceeds the limit, you see an error message and need to adjust your selection.
Within the App Connector group filter, you can see the number of App Connectors associated with the App Connector group.
If no App Connectors are selected, the top App Connectors from the Peak Memory Utilization chart are selected by default.
App Connector Details
The App Connector Details table provides information about the App Connectors selected in the Activity Monitor section. If no App Connectors are selected, the top App Connectors from the Peak Memory Utilization widget are selected by default.
The table covers:
- App Connector: The name of the App Connector.
- App Connector Group: The name of the group the App Connector is included in.
- Location: The city and country that the App Connector is connecting from.
- Actions:
- View: Click view to the App Connector Details page and App Connector Latency pages
- Edit: Click to edit the App Connector.
- Logs: Click to view the User Activity Diagnostic logs page filtered for this App Connector.
Evaluating Individual App Connector Details and Latency
For each App Connector, you can click the View icon for an App Connector in the App Connector Details table. For each App Connector, you can view:
- Details
The Details page provides information about the selected App Connector. It is divided into three sections:
- General Information
The general information available about the App Connector:
- App Connector Group: The name of the group the App Connector is included in.
- Location: The city and country that the App Connector is connecting from.
- Enabled: Identifies if the App Connector is enabled or disabled.
- Session Status: The status of the App Connector session during the time range. The potential session statuses are:
- Authenticated: The App Connector successfully authenticated.
- Authentication Failed: The App Connector was unable to authenticate to the Zscaler cloud.
- Disconnected: The App Connector successfully disconnected.
- Periodic Software Update On: The date and time of the next periodic software update for the App Connector.
- Last Software Update On: The date and time of the last software update for the App Connector.
- Scheduled Software Version: The next App Connector software version that the App Connector upgrades to.
- Current Software Version: The current App Connector software version during the time range.
- Connection Status: The connection status of the App Connector during the time range. The potential session statuses are:
- Connected: The App Connector is up during the time range.
- Disconnected: The App Connector is down during the time range.
Close
- App Connector Information
The values and percentages for each item in this section are initially based on the most recent data available as noted by the point in time listed on the right side of this section. The values and percentages change based on selections made in the Activity Monitor widgets below this section. The time also adjusts.
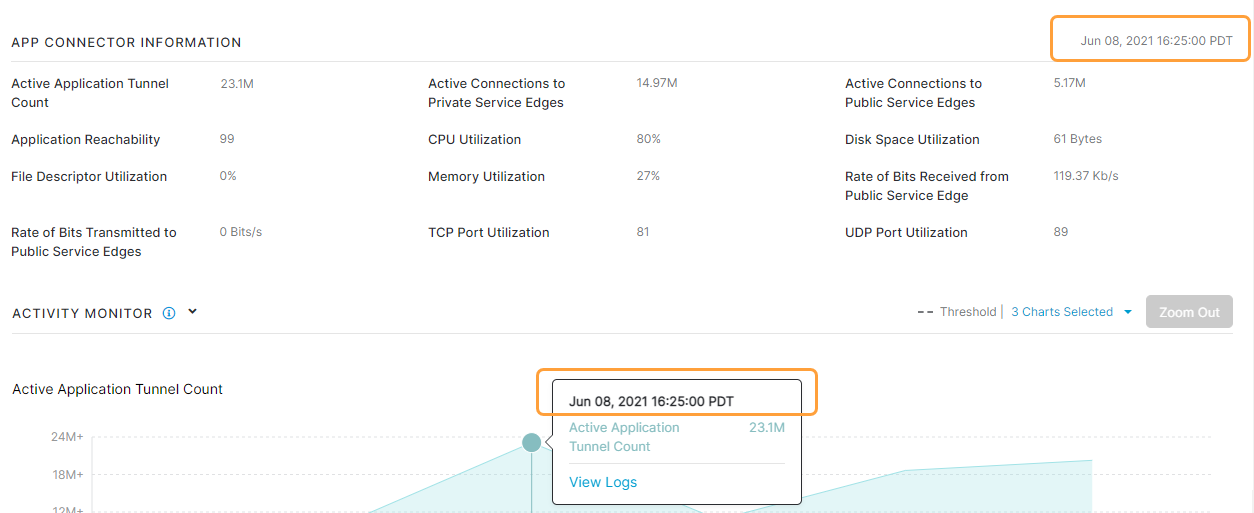
The information available about the App Connector includes:
- Active Application Tunnel Count: The number of active connections the App Connector had to applications for the point in time listed.
- Active Connections to Private Service Edges: The number of active connections the App Connector had to Private Service Edges for Private Applications for the point in time listed.
- Active Connections to Public Service Edges: The active connection the App Connector had to Public Service Edges for Private Applications for the point in time listed.
- Available Disk Space: The number of bytes available to the App Connector for the point in time listed.
- Rate of Bits Received from Public Service Edge: The number of bits received by the App Connector from Public Service Edges for Private Applications for the point in time listed.
- Application Reachability: The number of application targets the App Connector is monitoring for the point in time listed.
- CPU Utilization: The highest CPU used by the App Connector for the past 5 minutes.
- Memory Utilization: The highest memory used by the App Connector for the past 5 minutes.
- TCP Port Utilization: The number of TCP ports for IPv4 used by the App Connector for the point in time listed. It does not show App Connectors using TCP ports for IPv6.
- UDP Port Utilization: The number of UDP ports for IPv4 used by the App Connector for the point in time listed. It does not show App Connectors using UDP ports for IPv6.
- File Descriptor Utilization: The file descriptors used by the App Connector for the point in time listed.
- Rate of Bits Transmitted to Public Service Edges: The number of bits transmitted per second by the App Connector to Private Applications Public Service Edges for the point in time listed.
- Activity Monitor Widgets
The Activity Monitor section displays the same widgets with the same functionality as seen in the Activity Monitor section. Three widgets are selected automatically. They are:
- Active Application Tunnel Count
- Application Reachability
- Memory Utilization
- General Information
- Latency
The latency monitor widgets in the Latency tab show the latency trend from an App Connector to Public Service Edges for Private Applications in the selected time range. The time range for the Latency tab is different from the rest of the App Connector Dashboard. It is limited to data over a period between 30 Mins to 24 Hours, or you can select Custom Range to specify a custom start and end date. If you use Custom Range, the start date can be within the last 24 hours. This filter applies to all widgets in the Latency tab, and the default time is 30 minutes.
The widgets available are:
- App Connector To Service Edge TCP Latency
- App Connector To Service Edge Latency
Each widget shows the Public Service Edges for Private Applications that interacted with the selected App Connector during the time range. The widgets have the same functionality as seen in the Activity Monitor section.
For each widget, you can search by entering part or all of a Public Service Edge for Private Applications name or by using the following search query options with >, <, or = operators:
- location: The location of the Public Service Edge for Private Applications (e.g., location < San Jose).
- name: The name of the Public Service Edge for Private Applications (e.g., name = sj_serviceedge).
- value: A numerical value specific to the widget (e.g., value < 40).
Close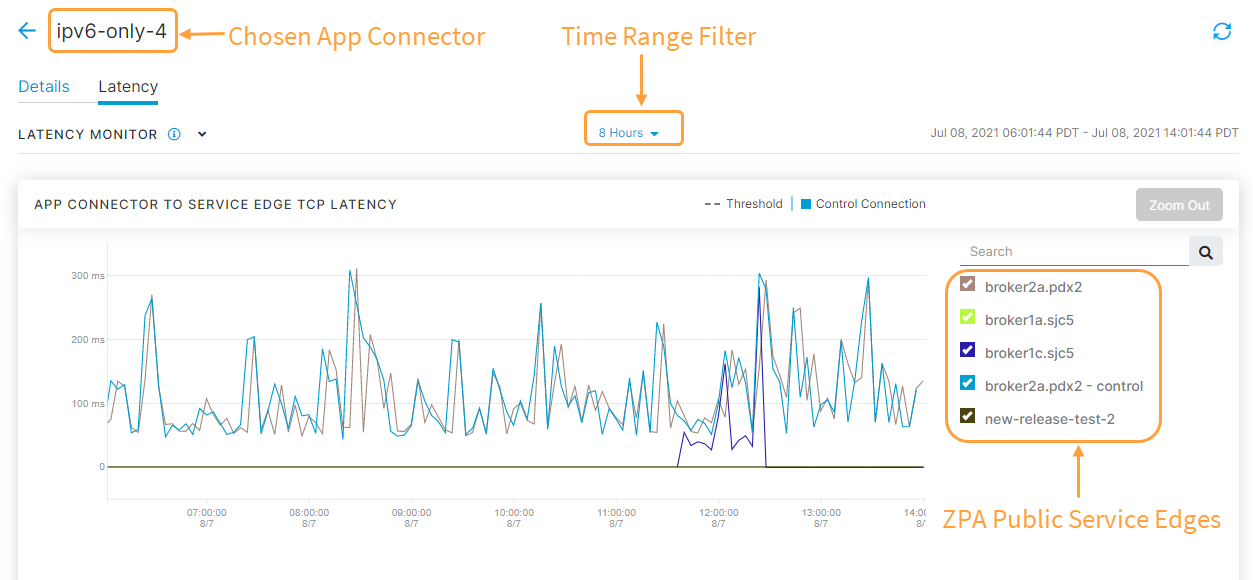
The Details tab is automatically selected.
